
Each year rainfall discharges around 505,000 km3 of water onto our planet, of which some 398,000 fall on the sea and around 107,000 on land. © Jon Fobrant-unsplash.
According to AQUASTAT, each year rainfall discharges around 505,000 km3 of water onto our planet, of which some 398,000 fall on the sea and around 107,000 on land. The lives of 7.8 billion people depend on the latter.
What happens with that water that falls on land? 56% is emitted into the atmosphere through the evapotranspiration of the plants that have absorbed it; 5% falls on rainfed crops, irrigating them naturally. The remaining 39%, around 42,000 km3, becomes surface runoff, which ends up in rivers and lakes or seeps underground into aquifers; this amount of water is defined as “renewable resources”: it is “usable” water that nature replenishes periodically through rainfall.

What happens with that water that falls on land? 56% is emitted into the atmosphere through the evapotranspiration of the plants that have absorbed it.© Rowan Heuvel- unsplash
The SDG 6 aims to ensure that, by 2030, humanity has full and fair access to these 42,000 km3; the threats to achieving this are considerable.
First there is population growth, which will increase the quantitative need for water for human life. In all likelihood there will be more than 8.5 billion of us by 2030, and many of the areas that will experience the greatest population increase are already under high water stress, like most subtropical regions, where the climate crisis will continue to increase droughts and violent weather events.
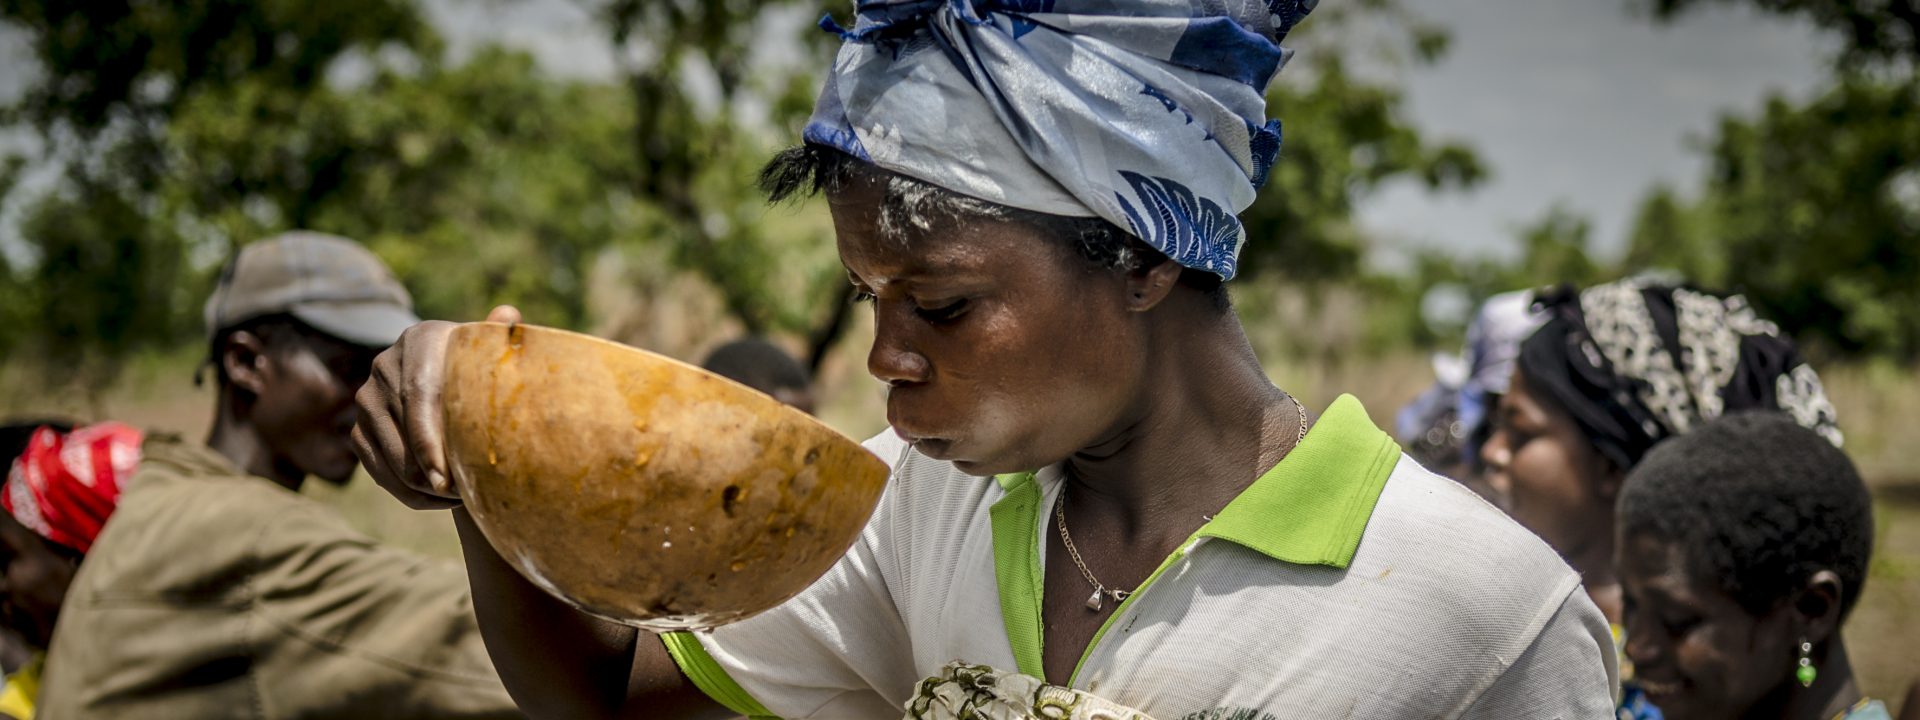
This is the goal 6.4 of the SDG 6: to substantially increase water-use efficiency across all sectors and ensure sustainable withdrawals and supply of freshwater to address water scarcity. © Luis Tosta-unsplash.jpg
The other threat to SDG 6 is inherent in development itself. The economy must continue to thrive to eradicate poverty (SDG 1), hunger (SDG 2), ensure access to health (SDG 3) and virtually attain most of the SDGs. This progress must strive to be the least dependent on water use, which means making progress in the efficient use of water. This is the goal 6.4 of the SDG 6: to substantially increase water-use efficiency across all sectors and ensure sustainable withdrawals and supply of freshwater to address water scarcity and substantially reduce the number of peoplesuffering from water scarcity. It is clear that the relativization of the term “substantially” will be important to assess the success of achieving the 2030 Agenda, especially after the damage and uncertainty Covid-19 has caused.
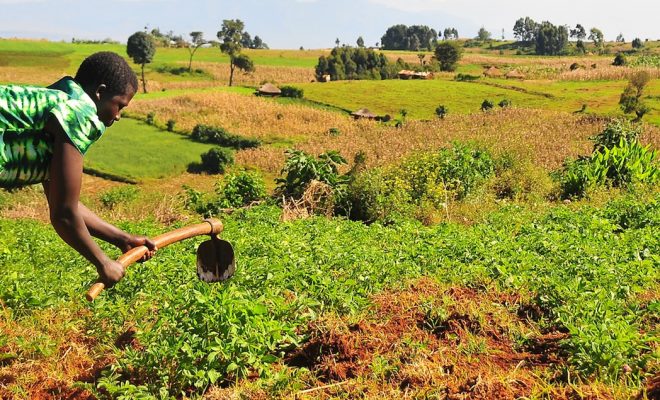
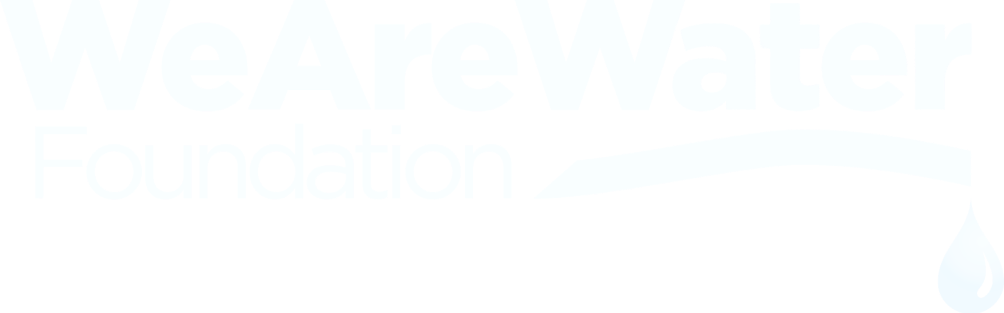
According to UNESCO, the use of water in the world has increased six-fold over the last century and is growing at a rate of 1% per year. It is therefore imperative to obtain data to analyze efficiency in all sectors, especially agriculture, which consumes 69% of the world’s water, compared to industry, which consumes about 19% and domestic supply, with a consumption of 12%.
How to measure water use efficiency?
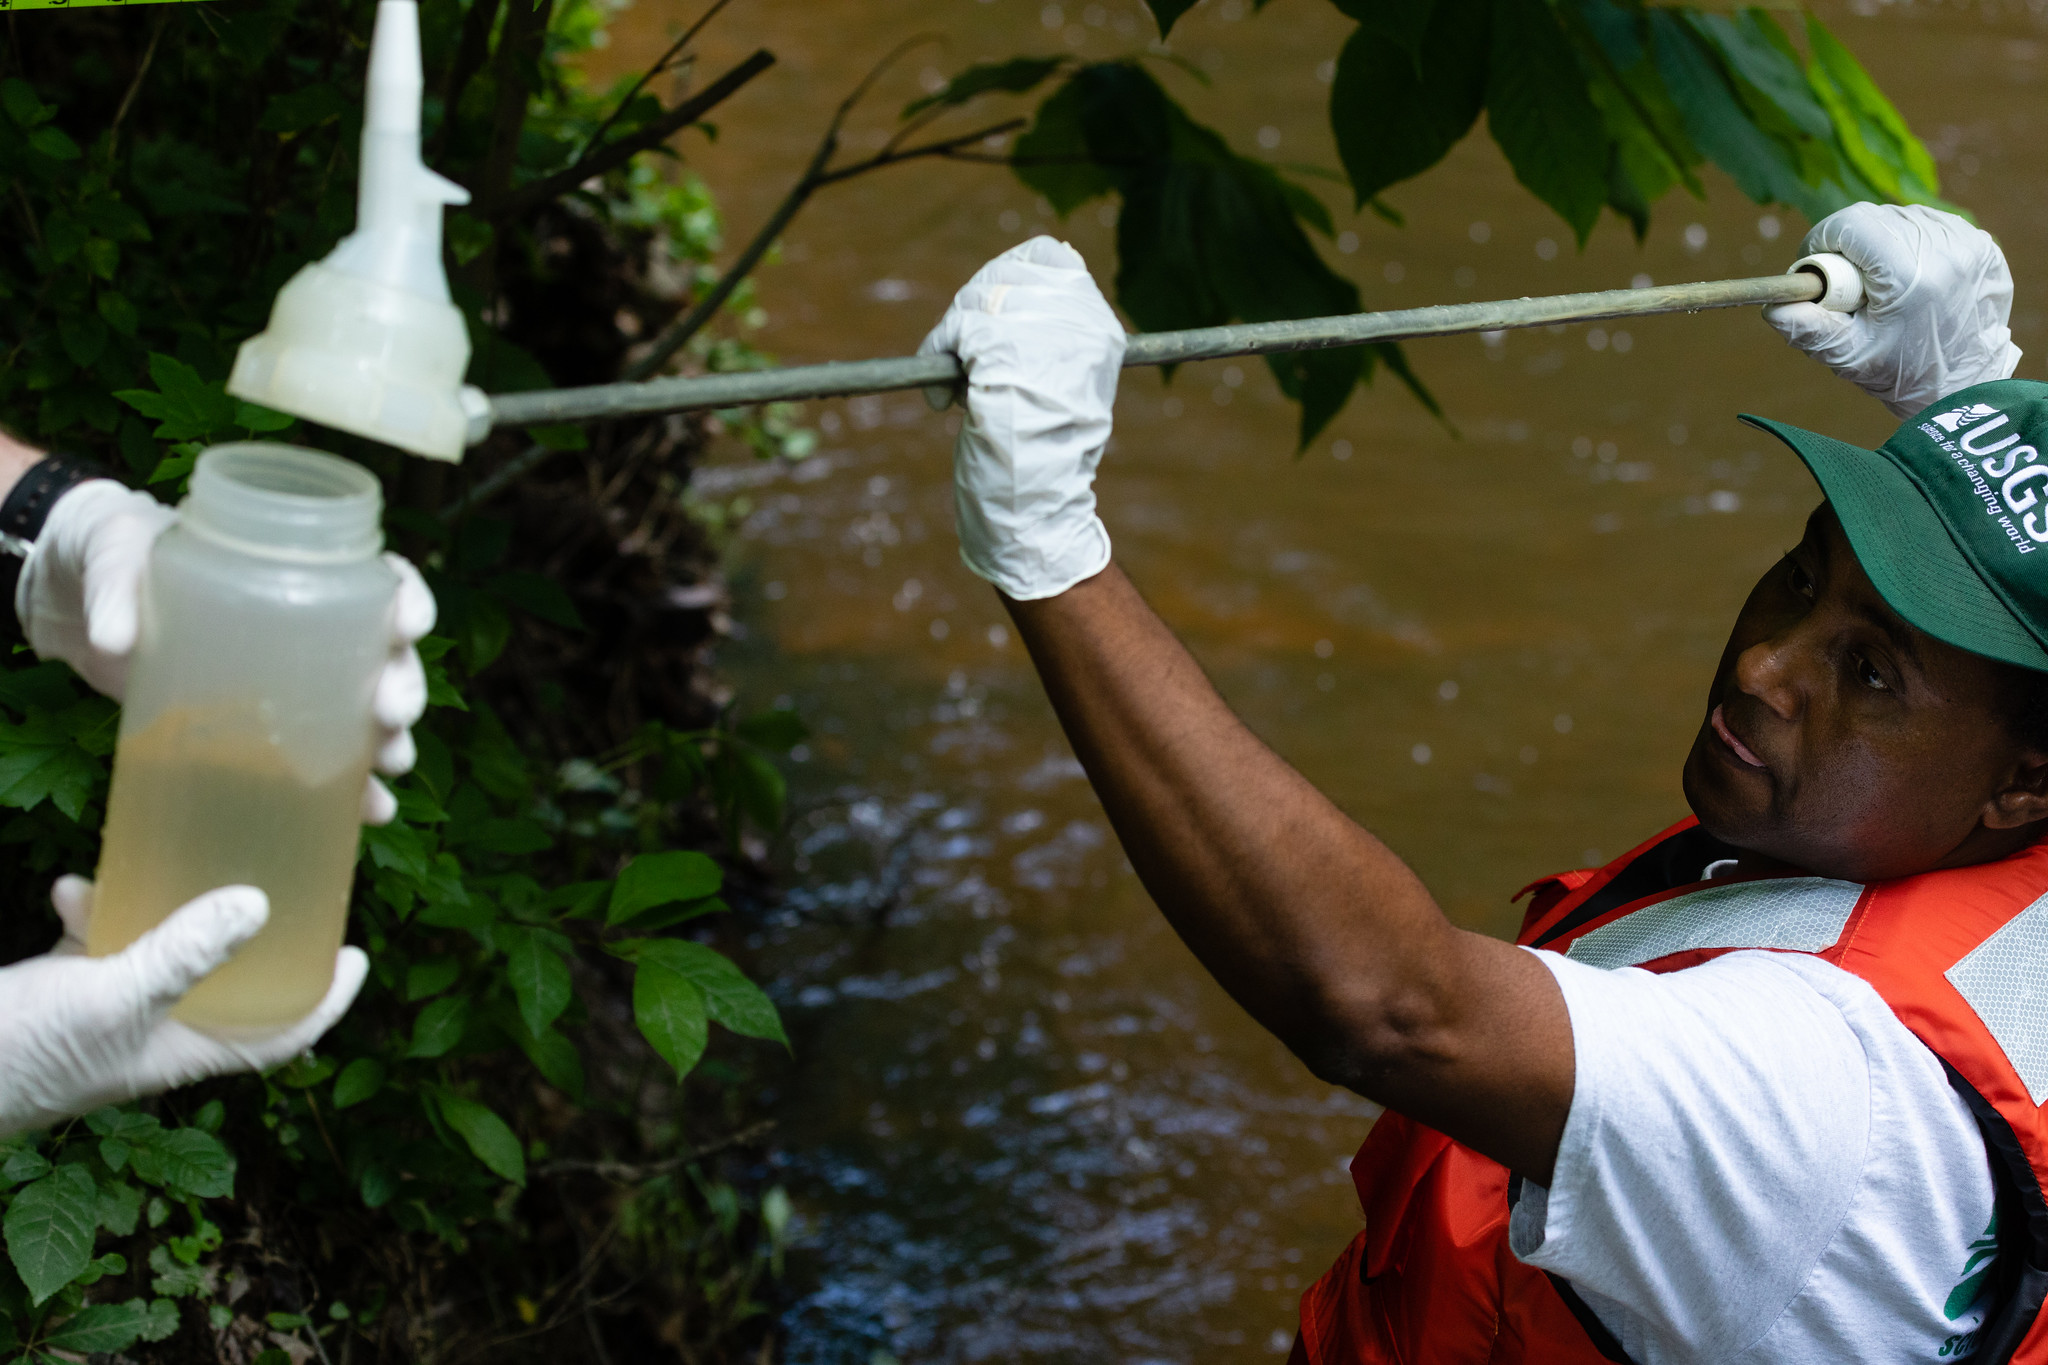
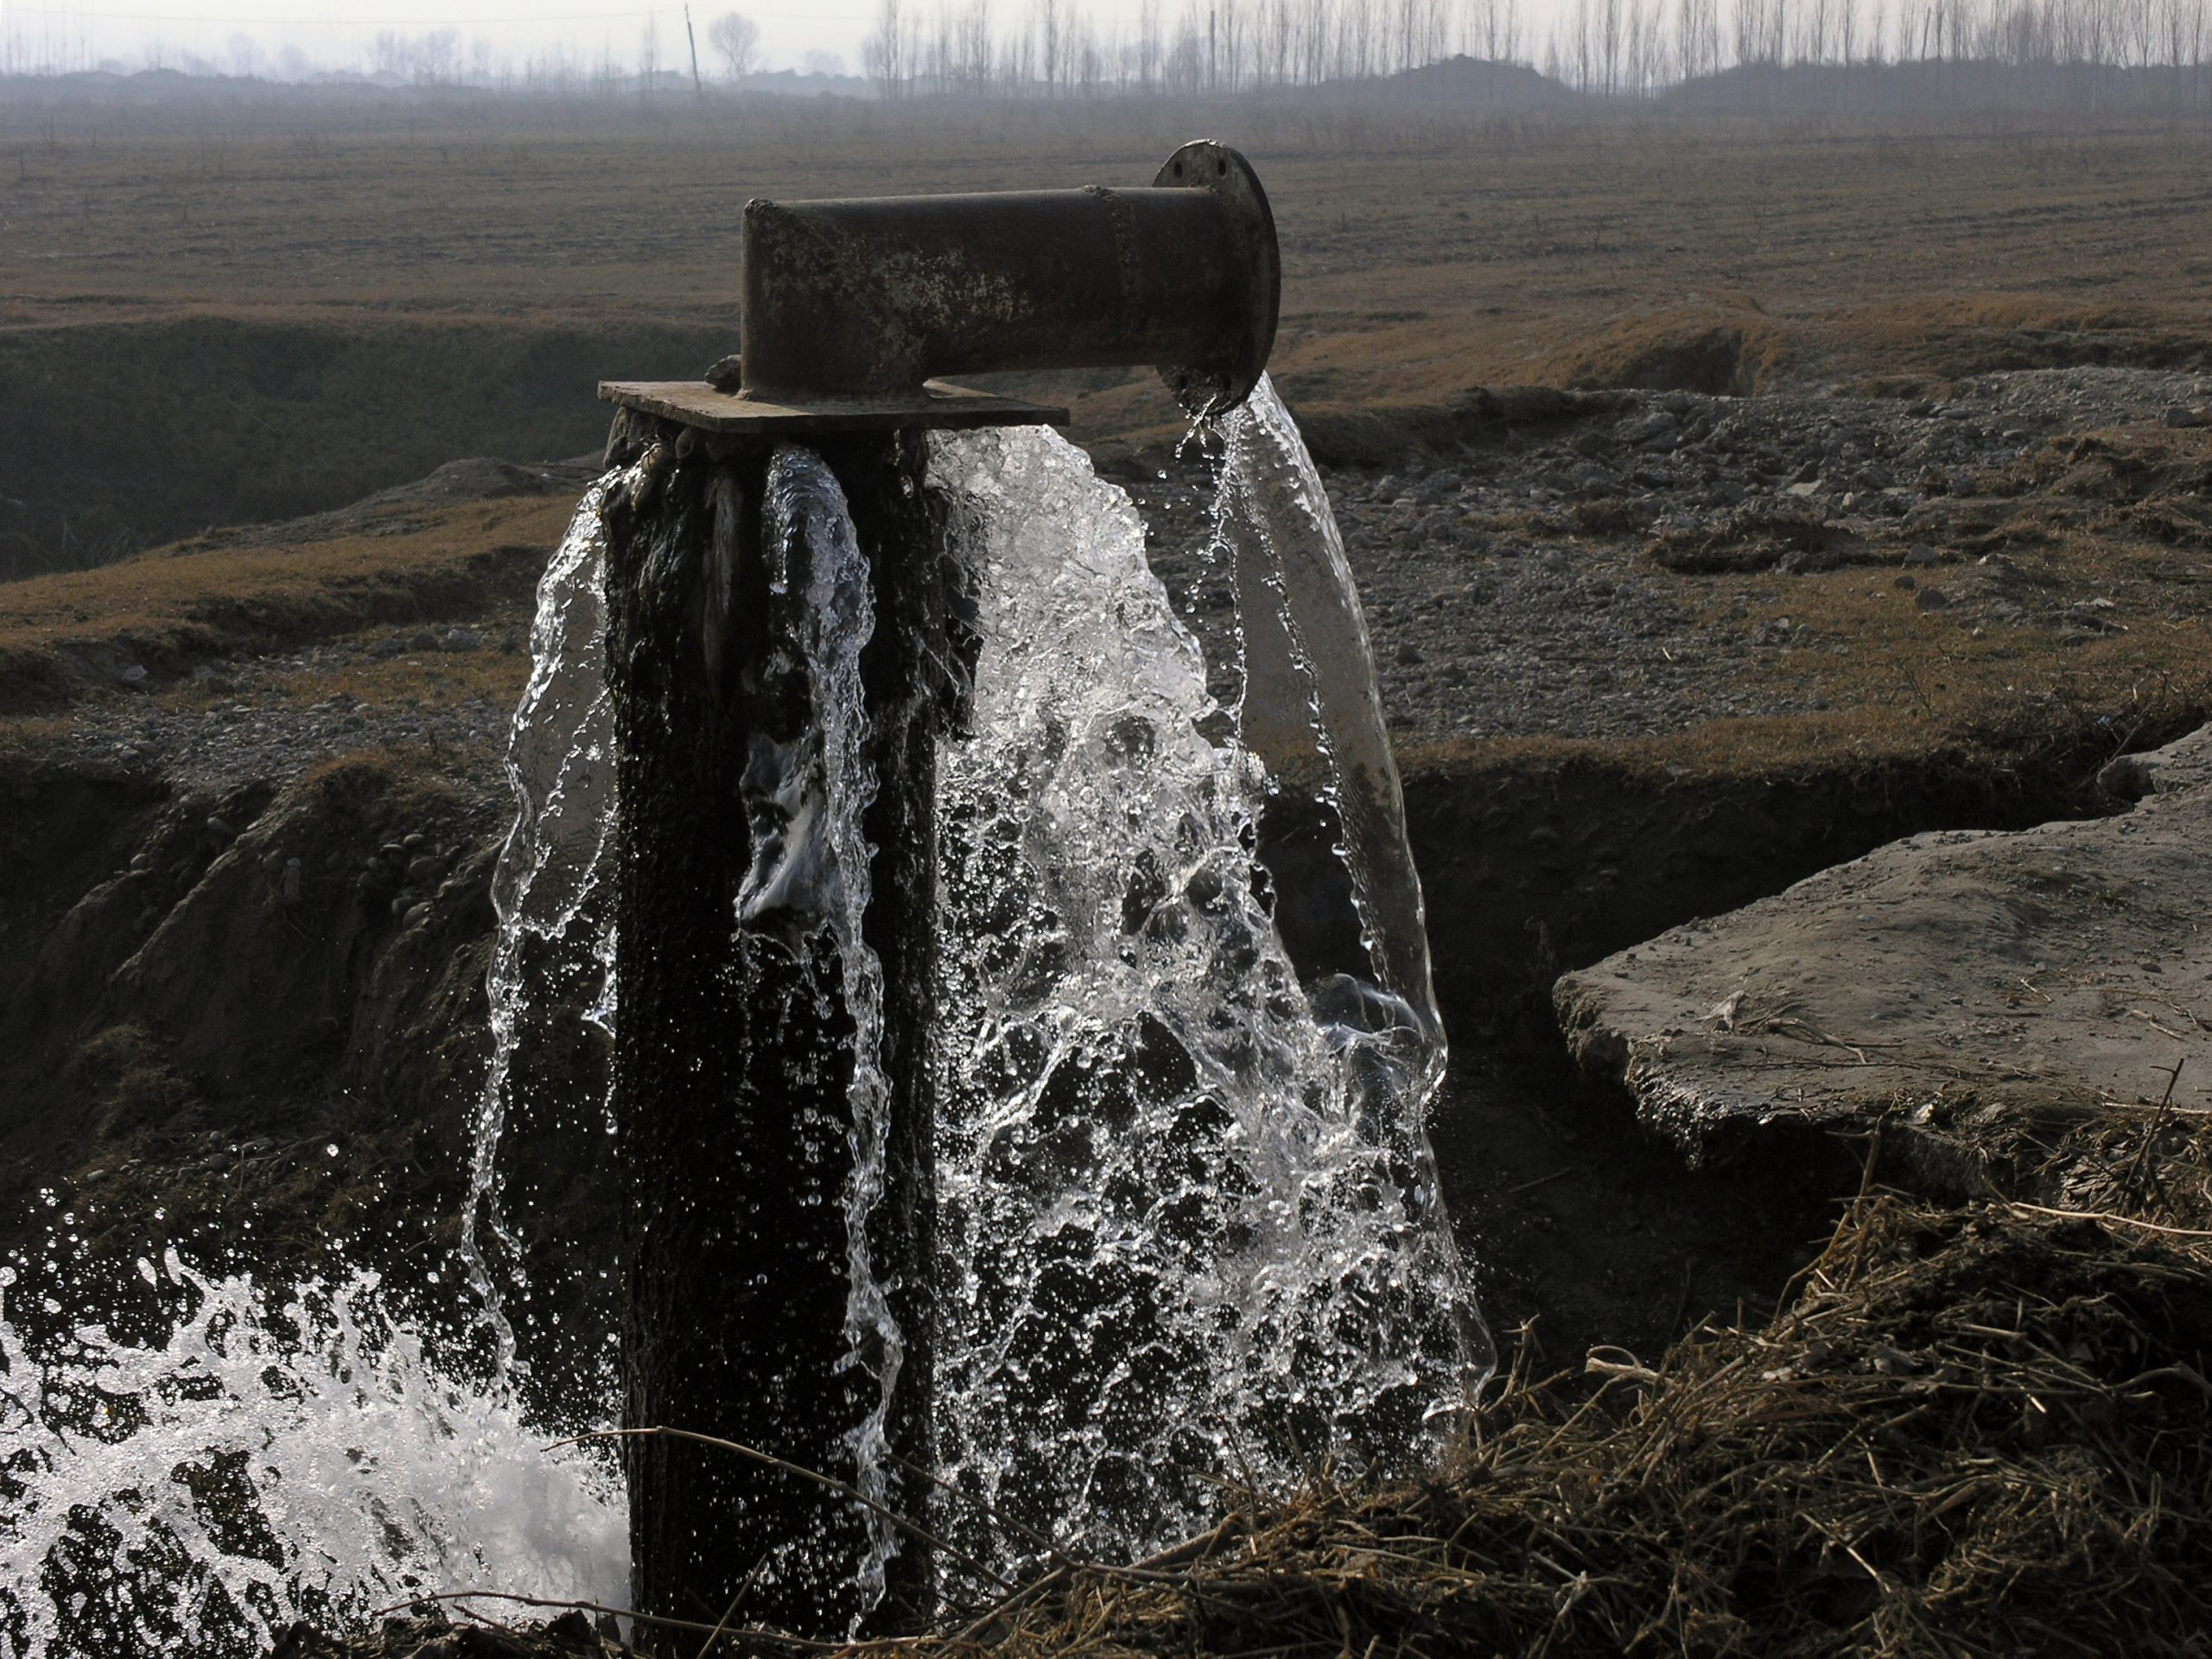
Water use efficiency implies obtaining more value with the available water resources, reducing consumption, pollution and the environmental. © Photo by Will Parson/Chesapeake Bay Program.
Water use efficiency in general could be defined as “doing more and better with less water”. From an economic perspective, it implies obtaining more value with the available water resources, reducing consumption, pollution and the environmental impact of its use in the production of goods and services at every stage of the value chain. In other words, improving water use efficiency means increasing water “productivity”.
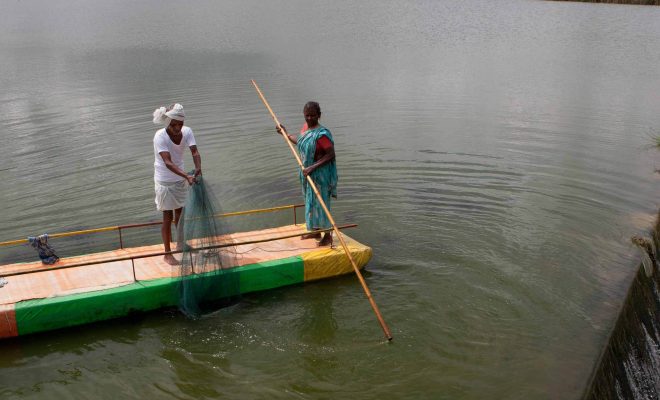
UN Water created two tools in 2015 to move forward in the efficient use of water: indicators 6.4.1 and 6.4.2. The latter, 6.4.2, assesses water stress and it is the easiest to understand: it tracks how much freshwater is being withdrawn by all economic activities, compared to the total renewable freshwater resources available. It is essentially an environmental indicator that allows us to track the physical availability of water. In other words, how much water can I use?
Indicator 6.4.1 is more complex and key to the adequate progress of economy: it provides a way to assess the change in the efficient use of water over time; in other words, it enables countries to assess to what extent their economic growth depends on the use of their water resources, that is, how am I doing in terms of water use?
This indicator is based on the calculation of the WUE (Water Use Efficiency) ratio, which is expressed in US dollars (USD) per cubic meter (m3) of used water. For example, the world average is USD15/m3; this means that every cubic meter of water used brings an added value of 15 dollars to the world economy. The higher the figure, the better the efficiency in the use of water.
The indicator thus expresses the extent to which a country’s economic growth depends on the exploitation of its water resources. It increases when the added value of the economy as a whole grows relatively more than the corresponding water use; when an economy grows in this way, it means that water is no longer a limiting factor. In the opposite case, when a country sees that its water consumption increases relatively more than its economy, this means that it is using water inefficiently; therefore its economic development might end up being blocked.
In 2018, 75 countries presented a ratio below USD10/m3; and 10 countries were below USD1/m3. The regions with lower values were South Asia (USD2/m3), Sub-Saharan Africa (USD7/m3); some of the areas with the highest values were Oceania (USD50/m3), Europe (USD38/m3) and the USA (USD38/m3).
Indicator 6.4.1, jointly used with 6.4.2, provides governments with the chance to plan their economic growth more effectively in terms of available water and to have a more accurate picture of the evolution of the natural capital of the resource in their area. If sufficient data are available, it is a way to find out the progress towards the attainment of the goal 6.4 with remarkable accuracy.
What generates inefficiency?
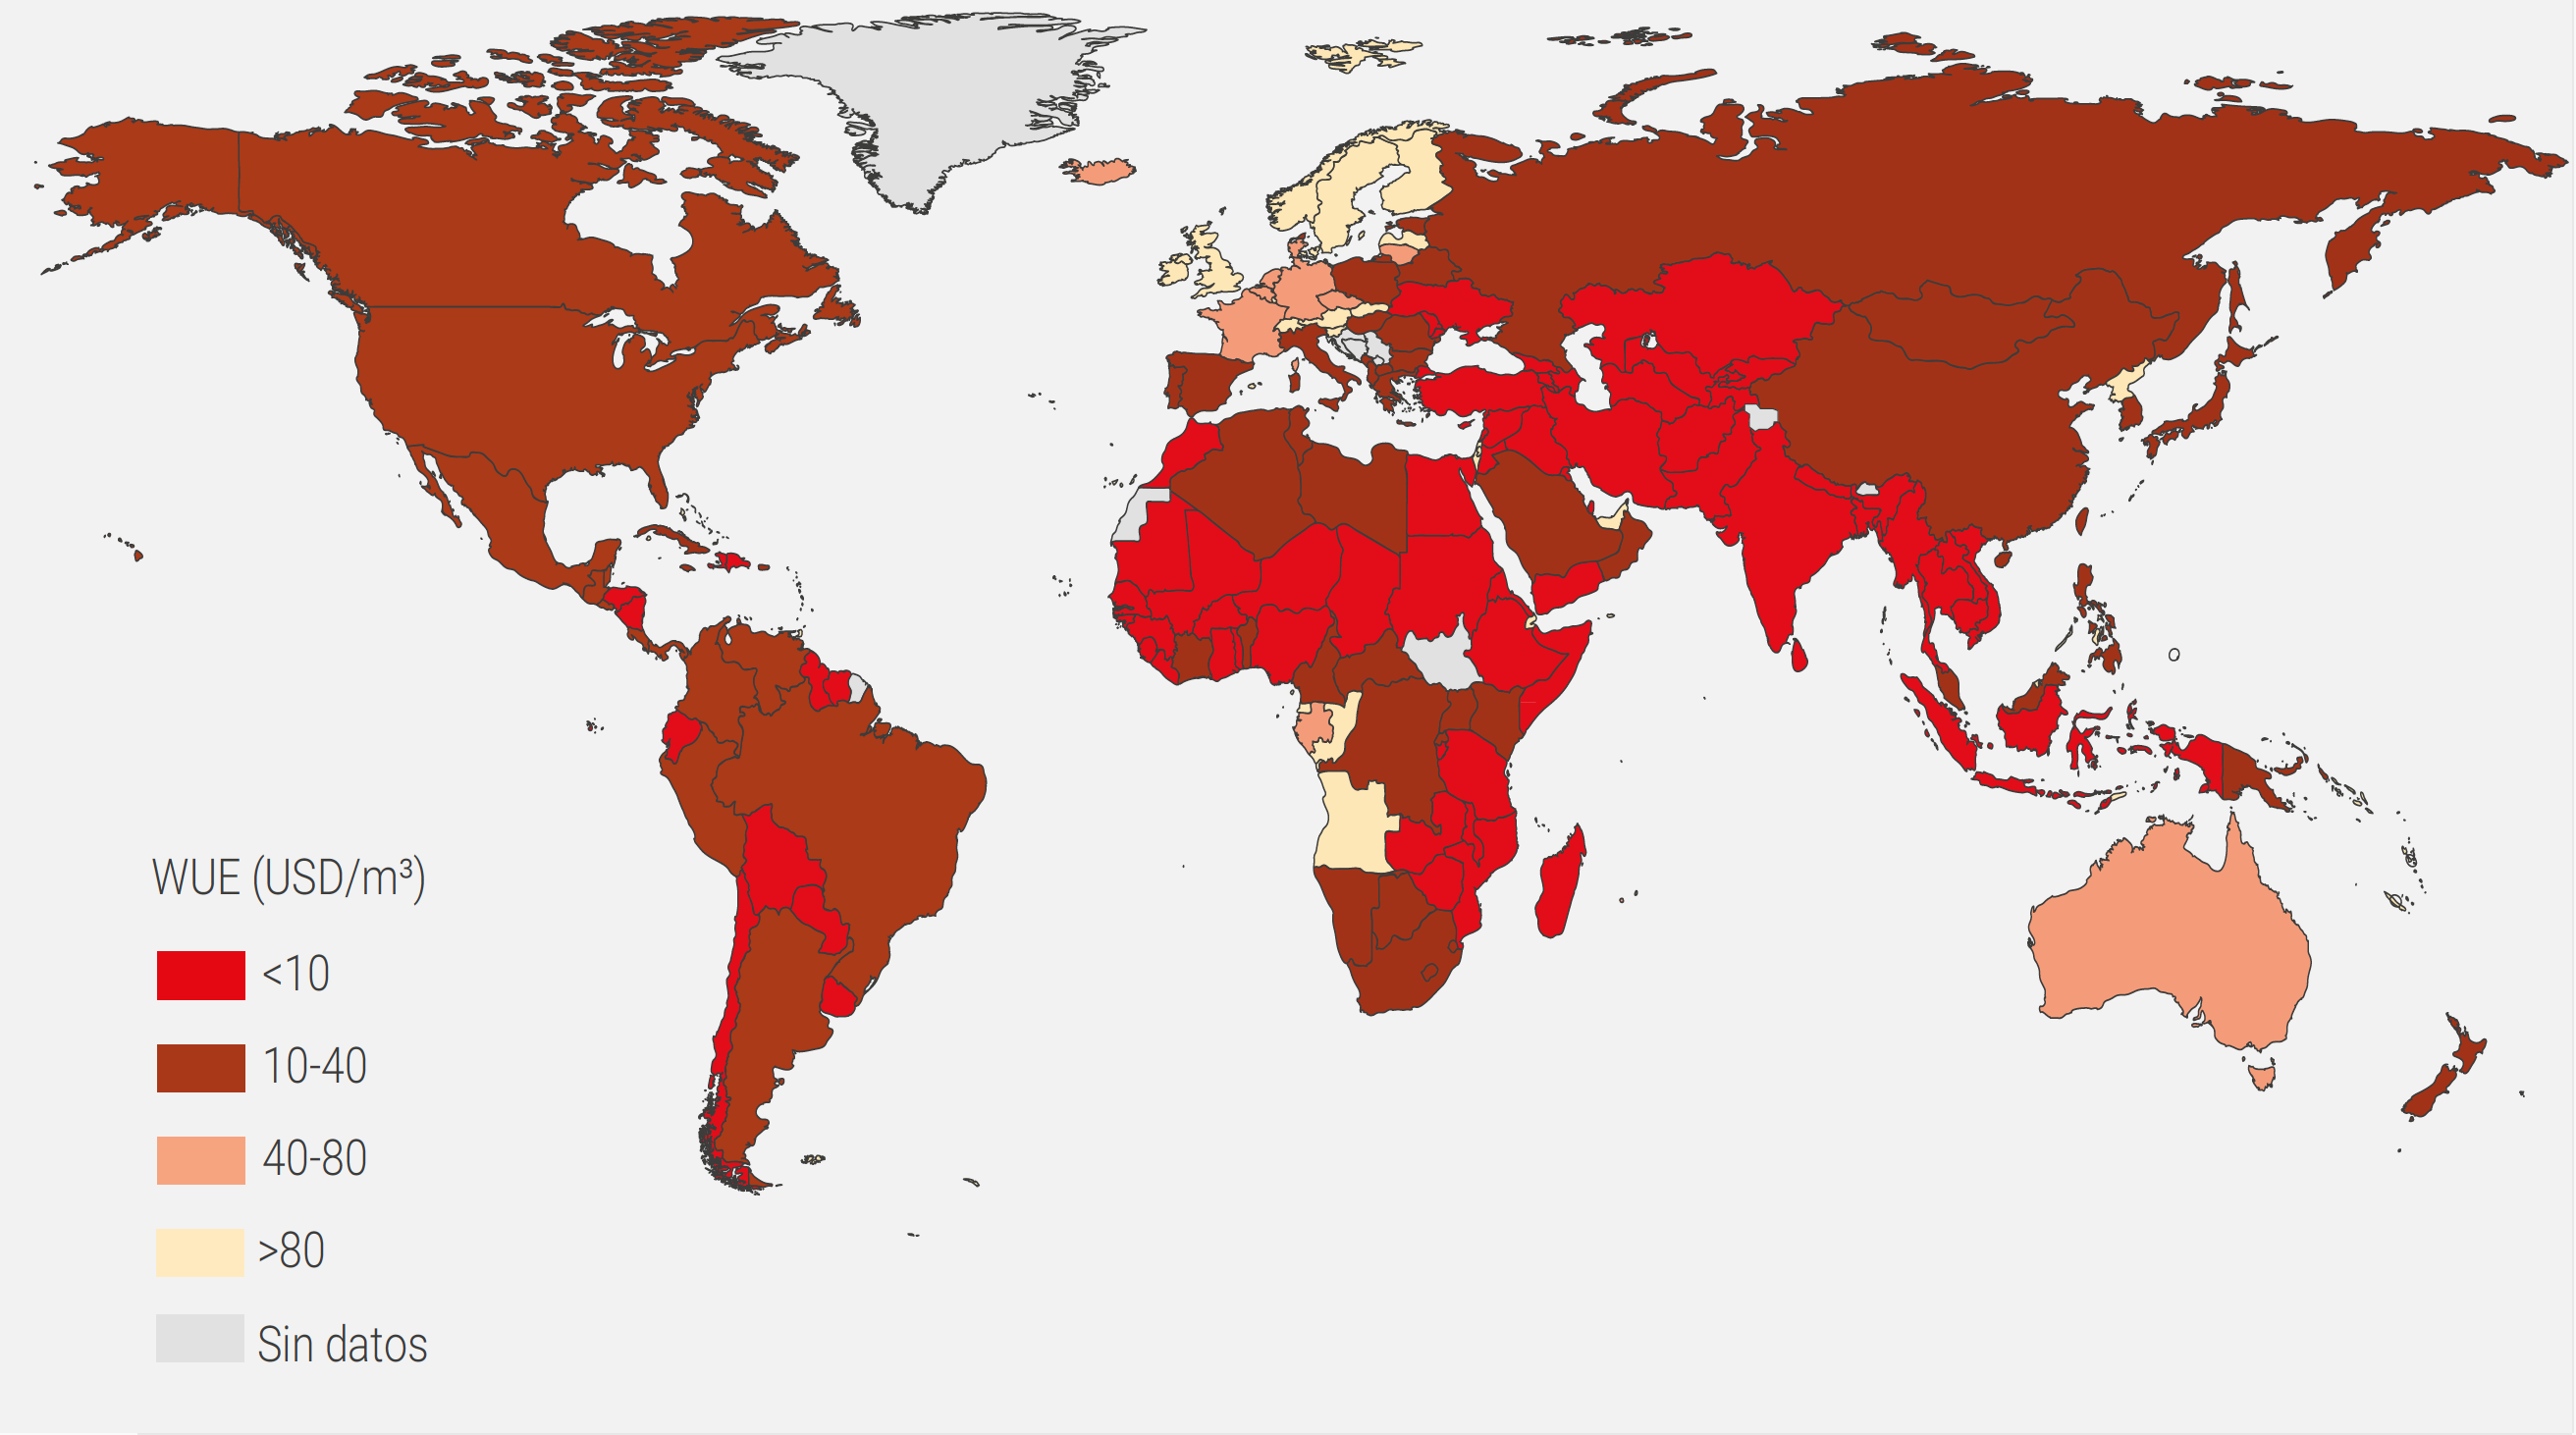
Map of the WUE (Water Use Efficiency) ratio, which is expressed in U.S. dollars (USD) per cubic meter (m3) of used water. The average in the world is of USD15/m3. Source: FAO / UN Water.
There is still a long road ahead and success depends mainly on obtaining adequate data from each country. This indicator is assessed globally by FAO, which has established an integrated monitoring system with UN Water to assess the progress on SDG 6.
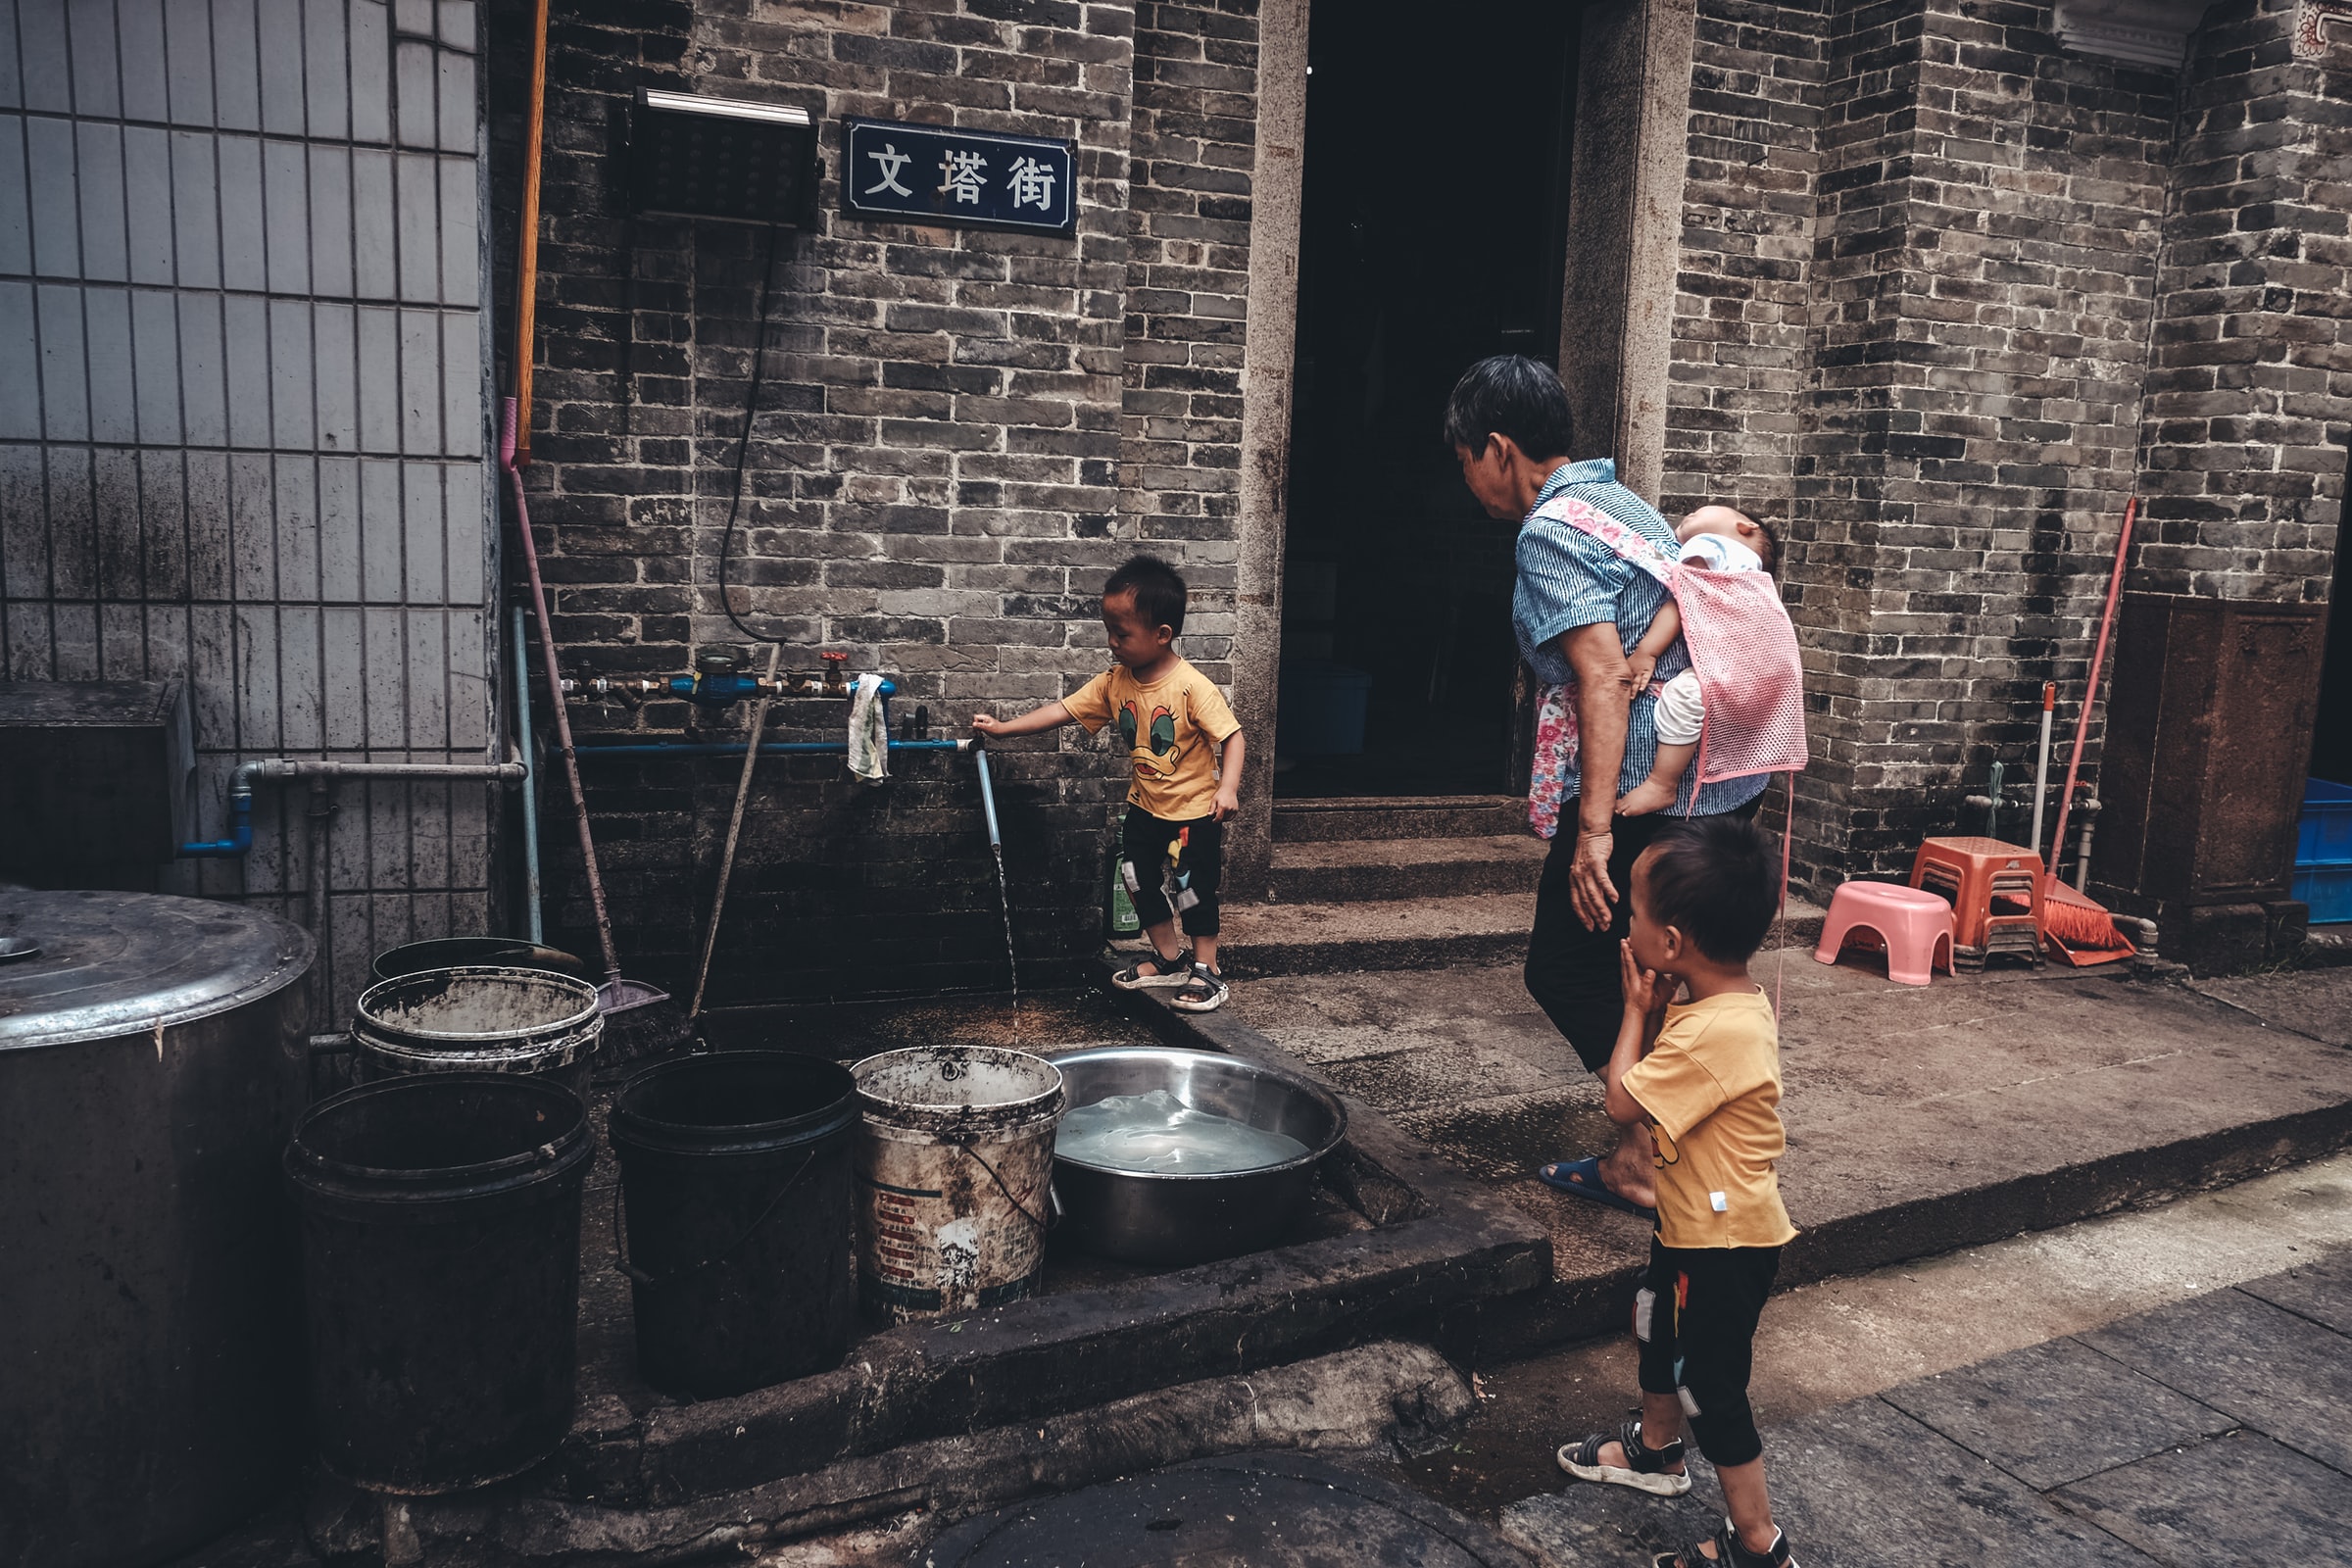
In general, water losses from extraction to consumption points, agricultural, domestic and industrial waste, the use of inadequate technologies and pollution are the drivers of inefficiency. Losses in the extraction and supply processes, generally included in the concept of Non-revenue water (NRW) exceed 40% of drinking water worldwide. This means around 45 million m3 per day, the equivalent of 45,000 Olympic swimming pools, an amount that could supply the needs of 200 million people.
In some African and Asian countries, the NRW rate exceeds 60% and they are often the ones with the lowest WUE values. The high investment needed to reduce this NRW must be achieved with governance that enables collaboration, partnership building and the development of abilities. This is one of the great challenges of Smart Reaction in architecture and urban planning, which is particularly urgent in developing large cities.
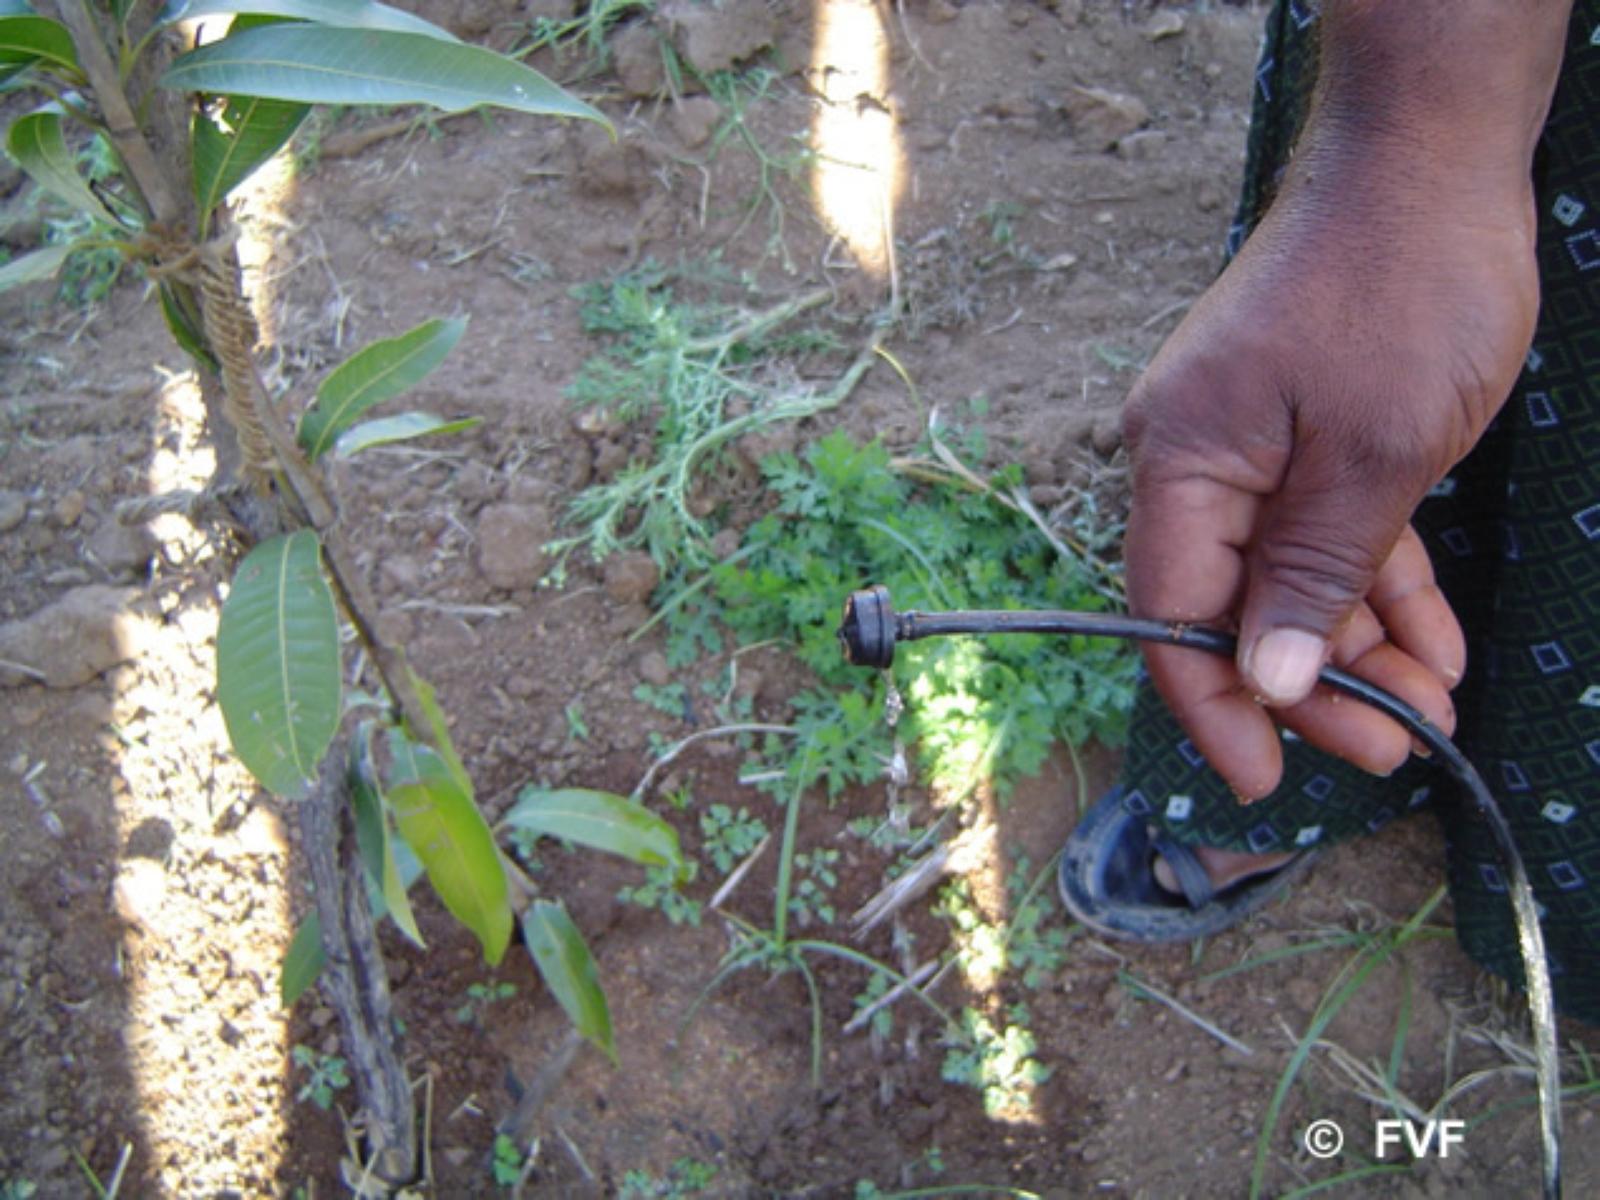
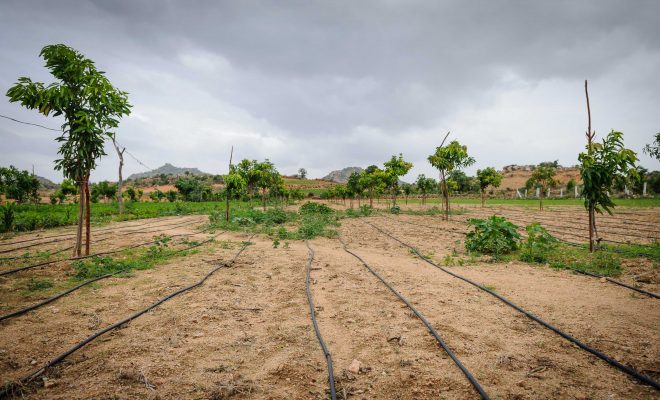
Achieving maximum efficiency in irrigation and the reduction of water consumption are two urgent goals.© Vicente Ferrer Foundation
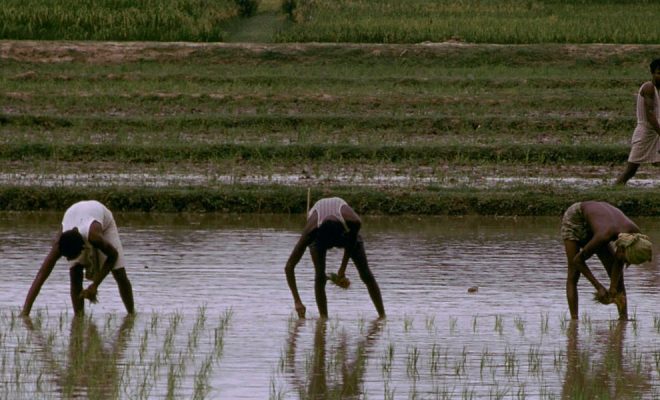
In agriculture, irrigation accounts for 70% of global water withdrawals and provides up to 40% of the food calories available on the planet. Achieving maximum efficiency in irrigation and the reduction of water consumption are two urgent goals, as is increasing productivity so that more crops or more value can be obtained with the amount of water applied to the crops.
The economy must continue to thrive to eradicate poverty (SDG 1), hunger (SDG 2), ensure access to health (SDG 3), © SuSanA Secretariat.
Although it seems there will be no quantitative shortness of water, the inequality in its availability across countries and climate regions could increase. The goal 6.4 will provide us a measure of whether we will be able to face the expected droughts without increasing hunger and having water available in cities. Its indicators are also good tools to introduce the concept of efficiency in the use of water in educational systems. Both endorse the importance of the good management of water from the scientific point of view and with intelligible data. This should constitute the establishment of a common language to obtain international awareness of the fact that efficiency is more important than rainfall.