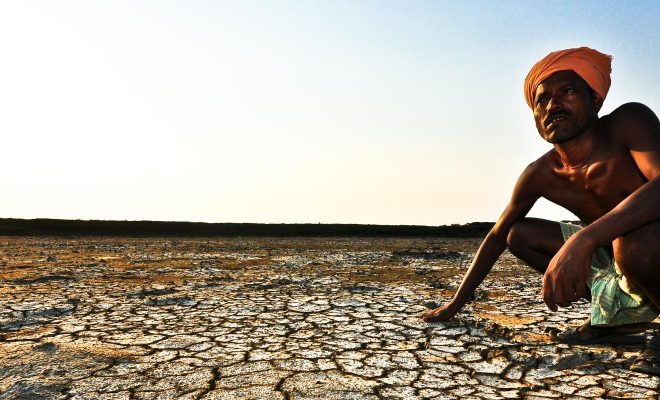
The world watches out for carbon dioxide (CO2) emissions. The excess gas is the main cause of global warming due to the greenhouse effect. We will show you a video and a chart with conclusive data to understand the importance of the compliance of the Paris COP21 resolutions. Global warming worsens the lack of access to water and it increases droughts.
One year in the life of atmospheric CO2
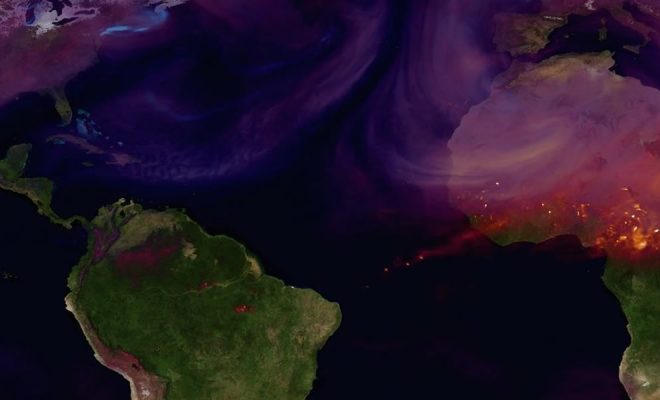
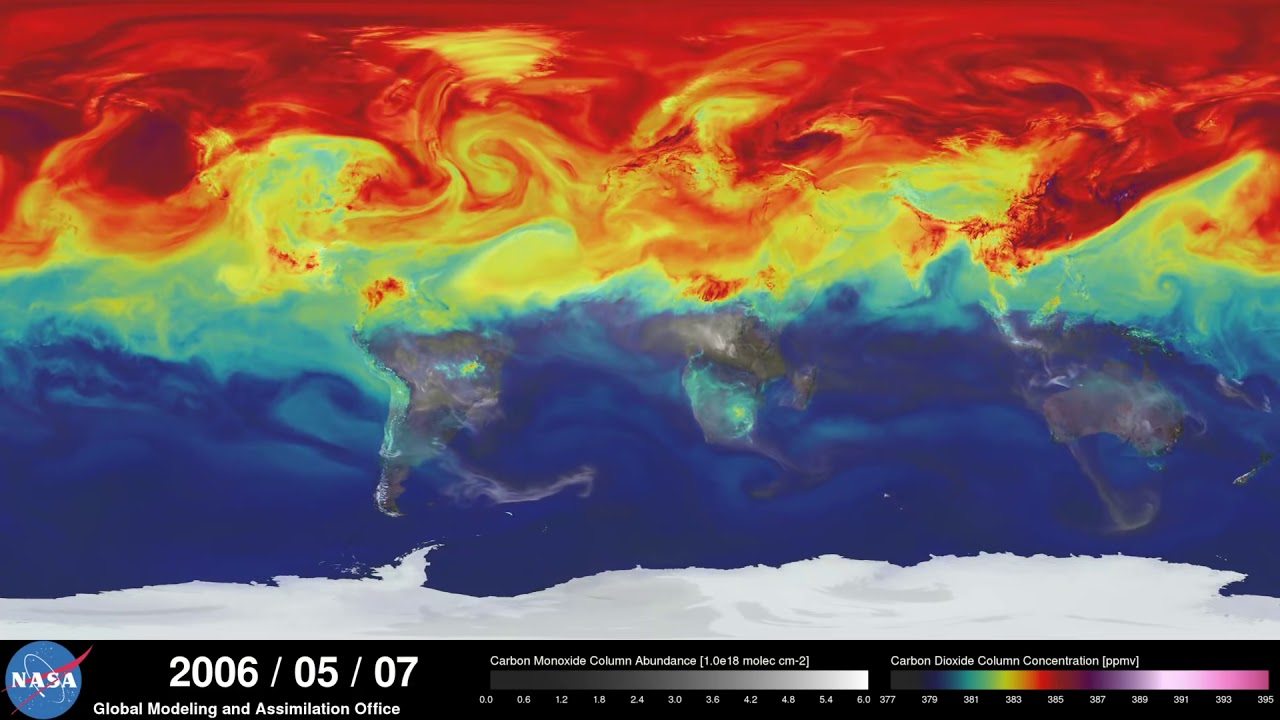
This video, generated by a high-resolution computer model at the NASA’s Goddard Space Flight Center, is spectacular and enlightening. It shows where CO2 is generated and how this gas travels through the atmosphere. In this video we will also see the carbon monoxide (CO) emission, a toxic gas that does not cause the greenhouse effect but is one of the more detrimental pollutants to the capacity of the atmosphere to regenerate by eliminating other pollutants.
CO2 is represented by a colour scale from blue to purple (at the bottom right); CO by a grey scale.
It is important to see:
- Most of the CO2 is generated in the Northern hemisphere, with three main focal points: the United States, Europe and China.
- Gases disperse following the general atmospheric circulation; that is, the prevailing winds that follow meteorological patterns (Look how the low pressure areas that turn counter-clockwise in the Northern hemisphere and clockwise in the Southern hemisphere are highlighted).
- In spring and summer in the Northern hemisphere, plants absorb most of the CO2 for photosynthesis. We can see this in the model as the red and purple colours (maximum concentration) vanish towards yellow and blue when the gas circulates from the end of May to September.
- But as soon as autumn advances, when photosynthesis decreases, CO2 starts building up again.
- Once a year has passed, half of the gas you see, is absorbed by plants and the bulk of the ocean. For this reason deforestation (one of the main causes of desertification) and the acidification of the ocean (which slows down its capacity to absorb CO2) are such a concern for scientists. The other half remains in the atmosphere contributing to the greenhouse effect that increases global temperatures.
- Carbon monoxide (grey scale) increases mainly in the austral winter months (from June to September). This is due mainly to the agricultural fires in Africa and South America, as this gas is produced by the incomplete burning of carbon, oil and wood. The industrialised countries also generate large quantities of CO, mainly originated by combustion engines. We can also see how these emissions are transported to other parts of the world. The average persistence time of CO in the atmosphere ranges from one to two months, most of the gas oxidises creating CO2, which contributes to the increase of its presence. Forest fires are great generators of CO.
What is our level of CO2?
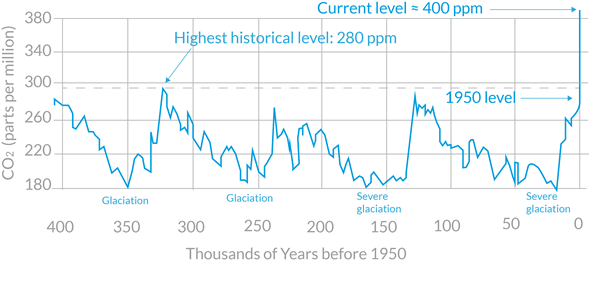
The history of CO2 in the atmosphere is represented in the following chart based on data from the U.S. NOAA (National Oceanic and Atmospheric Administration):
© Cris Barredo/Latitud 42
Variation in time (in thousands of years) of the concentration of CO2 in the air (in particles per million) based on the air bubbles analysed in the ice in Greenland, the Antarctica and the tropical glaciers. From 1950 onwards, the data come from direct measurements in the atmosphere. Source: NOAA (National Oceanic and Atmospheric Administration) Graphic art: C. Barredo / Latitud 42 / We Are Water Foundation.
This chart shows the estimated evolution of the concentration of CO2 in the atmosphere. It starts 450,000 years ago and ends in 2015. We may note that:
- There are seven cycles of advances and setbacks. During glaciations, the levels of CO2 were of around 200 ppm, and during the warmest interglacial period they reached around 280 ppm.
- From the Industrial Revolution onwards, at the beginning of the 19th century, the concentration of CO2 experiences a drastic increase.
- Between 2012 and 2013 the concentration increased by 2.9 particles per million, the highest yearly increase in 30 years and, in 2014, 400 ppm were reached.
In order to find out more, you may watch the presentation made by Jean-Pascal van Ypersele vice president of IPCC (Intergovernmental Panel on Climate Change) at the workshop Social Perceptions of Water and Climate, organised by the We Are Water Foundation as part of the celebration of World Water Day 2015. (View the video and download the presentation)
These figures are the ones that have established the goals of the Paris COP21: to reduce the emissions of CO2 is essential to prevent the average temperature of the atmosphere to rise more than two degrees before the end of the century. The availability of water in the planet depends largely on this achievement, as global warming, caused by the greenhouse effect, increases droughts in the most vulnerable areas and torrential rains that erode the soil. This is already happening and it is supposed to continue with greater intensity in the future.
What can we do?
Although the nearly 200 government committed to the COP 21 agreements are the ones who will decide on the compliance of the goals, there is a lot each one of us can do.
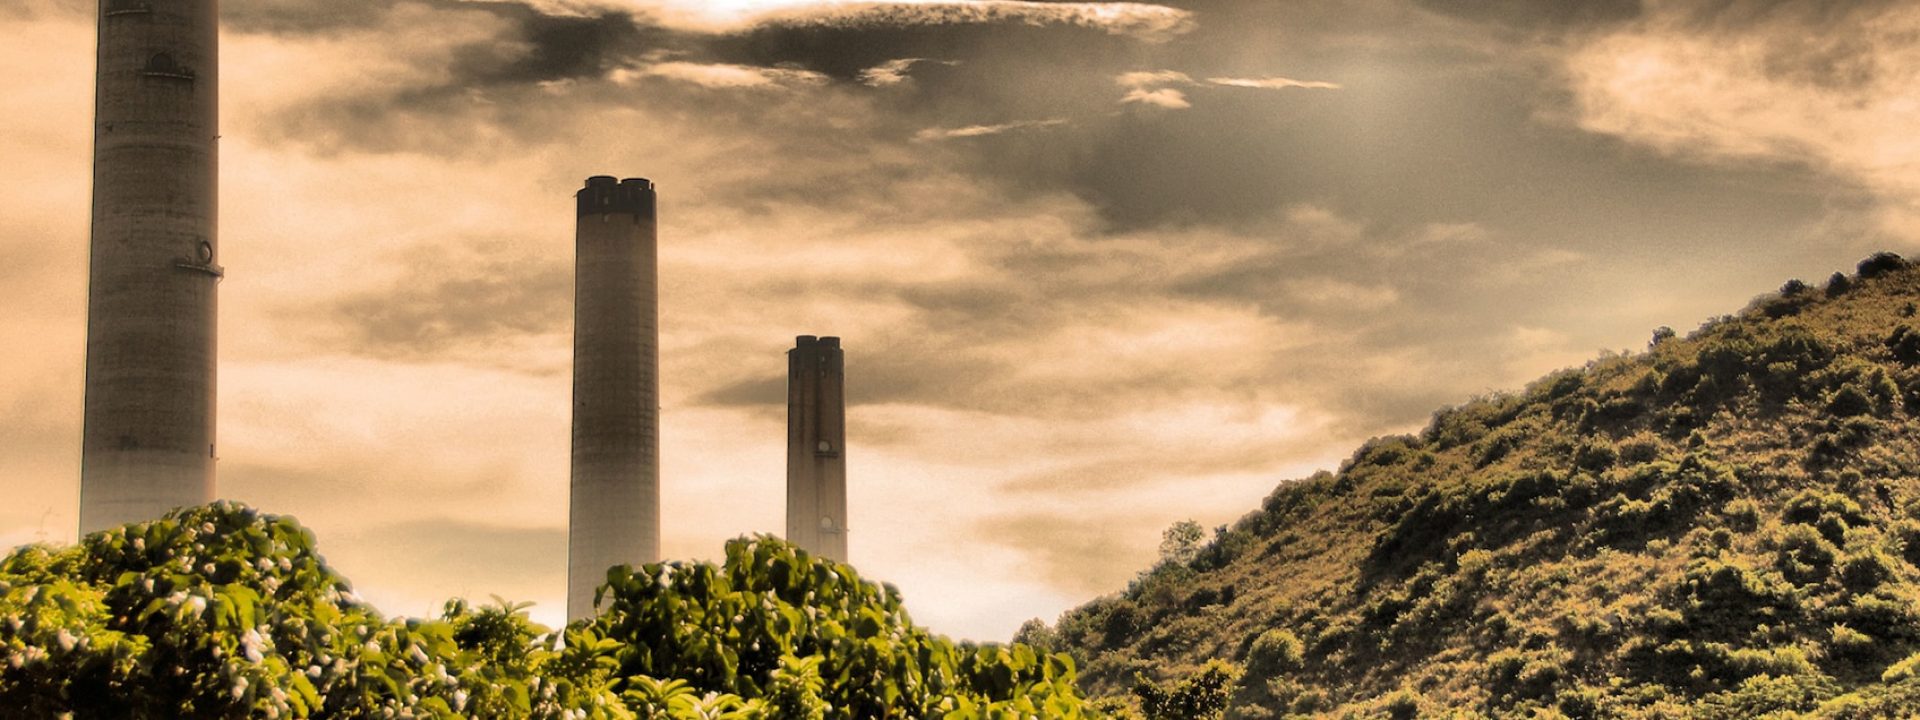
First of all, to reduce any combustion process we provoke directly, such as the use of the car or the burning of wood; we also need to avoid any unnecessary electrical expenditure, which is likely to be high: lighting, domestic appliances, air conditioning and heating are responsible for a great part of the CO2 columns you have seen in the video.
We also need to be aware that we need to fight deforestation. Each tree that is lost results in CO2 that remains in the atmosphere. We all need to be aware of a perverse cycle: if temperature increases, so will do the transpiration of vegetation, with the resulting reduction of humidity in the soil; if we add less rain and more violent downpours to this, we obtain more erosion and deforestation, with the resulting reduction in the absorption of CO2.
In future articles we will revise more information that explains climate change and its relationship to the world of water.