©World Bank
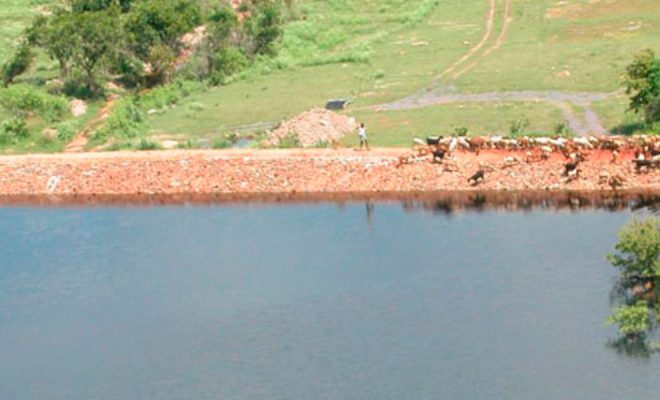
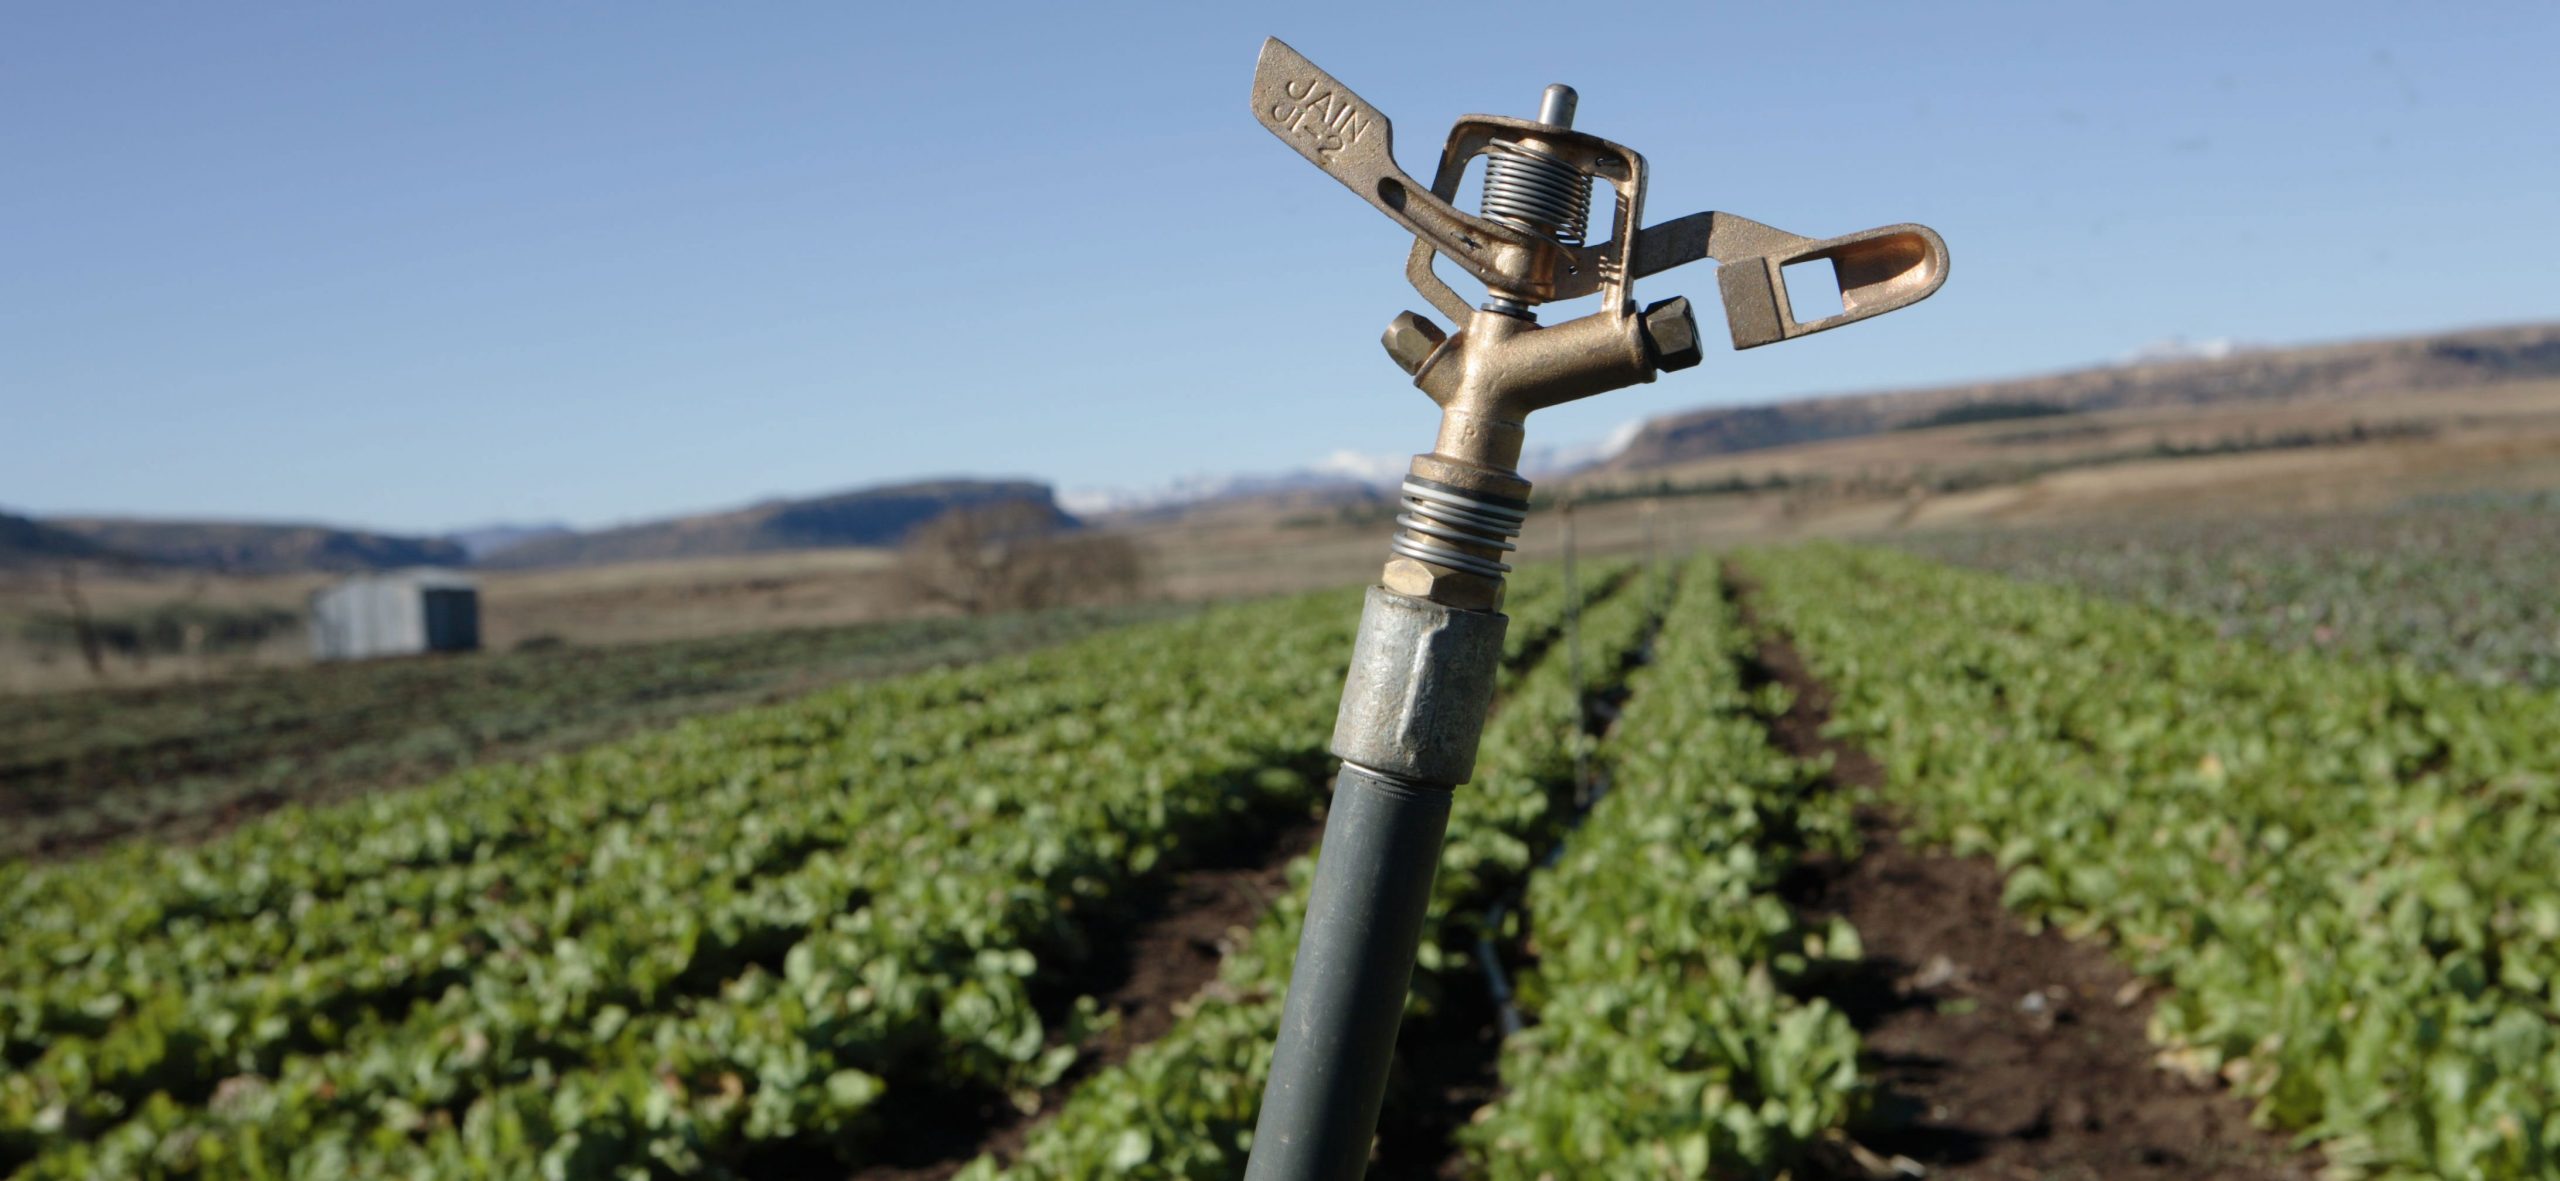
The irrigation water is registered in the “blue water footprint” as the surface and groundwater, such as rivers, lakes, reservoirs or aquifers.
It is easy to imagine that agricultural products consume water: rainwater and humidity from the atmosphere, irrigation water and groundwater. But it is more difficult to imagine that this expenditure depends on where, when and how the crops are grown and on who buys and consumes the products. This is what the study on the “water footprint” reveals: any production process or provided service implies an expenditure of water, a factor that was fairly unknown one decade ago and that provides an essential tool for the sustainable development of mankind.
The water footprint concept was created in 2002 by the Dutch national Arjen Ysbert Hoekstra, a professor at the University of Twente. Back then, ecologists, environmentalists and geographers used the “virtual water” concept in their calculations, which had been developed by the British geographer John Anthony Allan in 1993, after studying the scarcity of water in the Middle East. Allen defined virtual water as the total volume of water used directly or indirectly to manufacture a specific product.
Hoekstra went one step beyond with the water footprint, and considered in his calculations the whole amount of water used in the supply chain of a product; this includes not only the amount of water added to the product itself, but also the water that has been polluted or dumped into a different basin or into the sea or even the water evaporated in all processes. The water footprint links therefore end consumers, manufacturing companies and traders.
Hoekstra’s team established that each individual had an annual water footprint of 1,385 cubic meters, that is, the volume of half an Olympic swimming pool each, which is equivalent today to a global water footprint of 7.45 trillion cubic meters annually. It is the volume of freshwater used by mankind to live.
A new classification of freshwater
One of the most beneficial contributions of the water footprint is the way of calculating it, as it allows a new vision of the distribution of water resources all around the world. First of all, a classification of used water is needed. Hoekstra defined the “green water footprint” or “green water” as the volume of rainwater, the water stored in the ground as humidity and the one evaporated during production; the “blue water footprint” as the surface and groundwater, such as rivers, lakes, reservoirs or aquifers; and the ”grey water footprint” as the volume of water polluted during the production process. Not a single drop escapes this conscientious calculation that evolves day by day and that you can see represented in the maps by countries below:
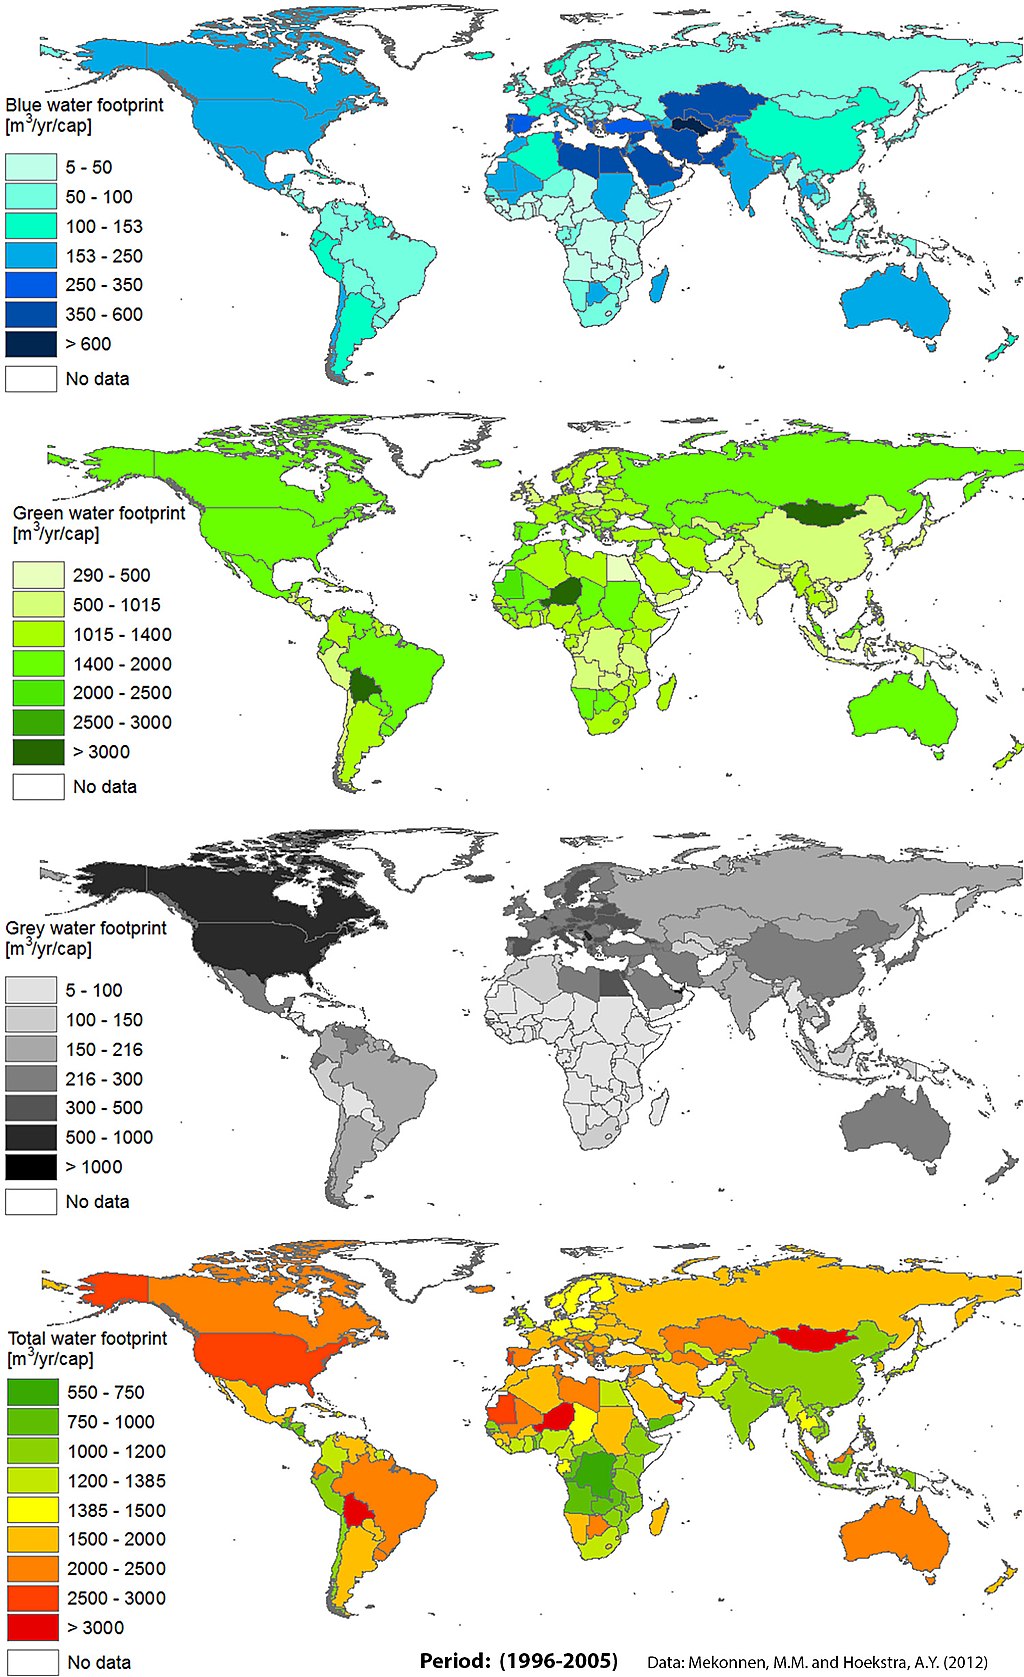
Blue, green, grey and national footprint per capita. ©By Sampa [CC BY-SA 4.0 (https://creativecommons.org/licenses/by-sa/4.0)], Data: Arjen Y. Hoekstra1 and Mesfin M. Mekonnen, Department of Water Engineering and Management, University of Twente (2012)
This new way of looking at things was clearly seen in 2008, when the World Wildlife Fund: WWF published a study of the water consumption in the UK based on the water footprint at the 2008 World Water Week in Stockholm. Its conclusions established that while the average consumption of British citizens (their water bill) reached 150 liters per day and person, their “real” consumption reached 4,645 liters, nearly 30 times higher; in other words, the goods and services consumed by the British indirectly required much more water than what they directly used in their homes and companies.
This approach has created a paradigm shift in the management of water resources and of the general sustainability of the planet. It is another way of understanding “water consumption”, which makes clear the difference between direct use, which is the one included in the bills of homes and companies, and the indirect one, which is included in all products and services we consume, and which is dramatically higher.
The distribution of the water footprint varies greatly between countries and provides us an excellent baseline for mapping the hidden trade of water. Among the “water importing countries” such as the United Kingdom, Germany stands out, with 69% of its water footprint coming from abroad, and Japan, one of the countries with the highest rate, 77%. India and Congo, with 3%, are among the countries that import less water. Some Mediterranean countries have more balanced proportions: Spain has an external water footprint of 43%, France, 47% and Greece, 46%. You can browse the global water footprint on the interactive map of the Water Footprint Network.
©François Bianco
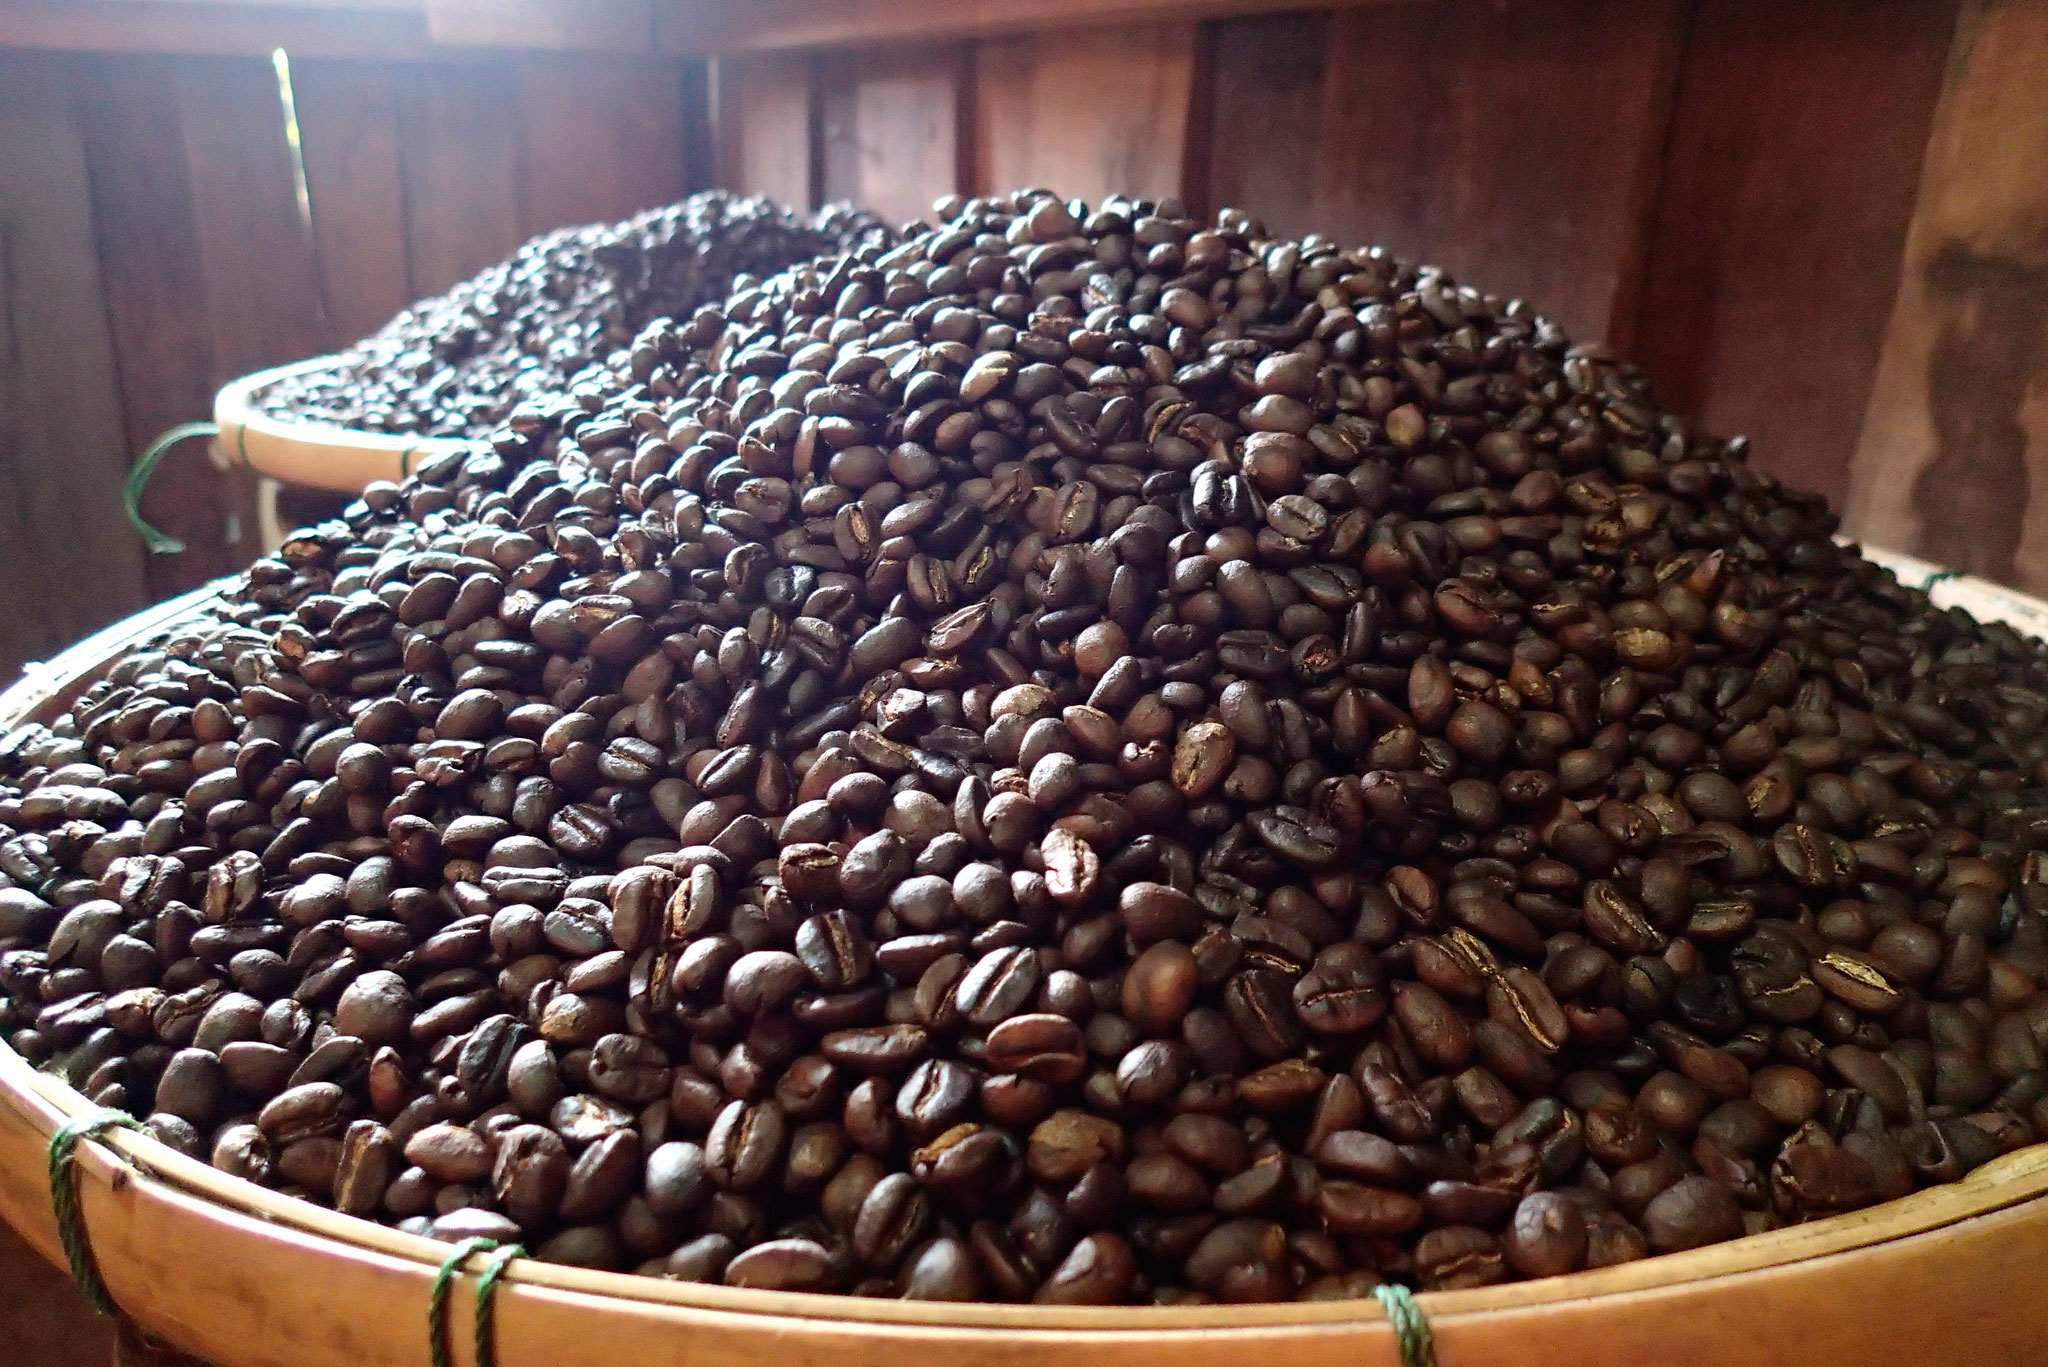
In order to produce 1 kilo of roasted coffee, and therefore a cup of coffee has a water footprint of 130 liters.
Agriculture, the greatest water footprint
As agriculture is the sector that consumes more water, (between 70% and 90%, depending on the country), food and products with plant origin, such as textiles, are the ones with the highest water footprint. Nearly 92% of the global water footprint belongs to the production of food. Coffee and beef are the ones that consume the most. According to figures of the Water Footprint Network, around 18,900 liters of water are consumed to produce 1 kilo of roasted coffee, and therefore a cup of coffee has a water footprint of 130 liters; that means that when we drink a cup of coffee, we are really “drinking” 130 additional liters. An amount of water that is similar to the one we find in a 160-gram apple or a 150-gram banana.
A 100-gram veal fillet “contains” 1,500 liters of water, as the following needs to be taken into consideration: after the average three years needed for the animal to grow and to produce 200 kg of boneless meat, more than three million liters of water will have been consumed; it is necessary to include the water the animal drinks, the fodder it eats and the services it requires (transport, vet, etc.) throughout its life. To calculate the water footprint of food, the We Are Water Foundation launched the app for mobile phones We Eat Water, very useful as it also includes many recipes from all around the world.
The awareness of the water footprint of food has also reached haute cuisine. In this video, Josep Roca, from Celler de Can Roca, clearly explains this in an interview for the We Are Water Foundation:

© Mike Beauregard
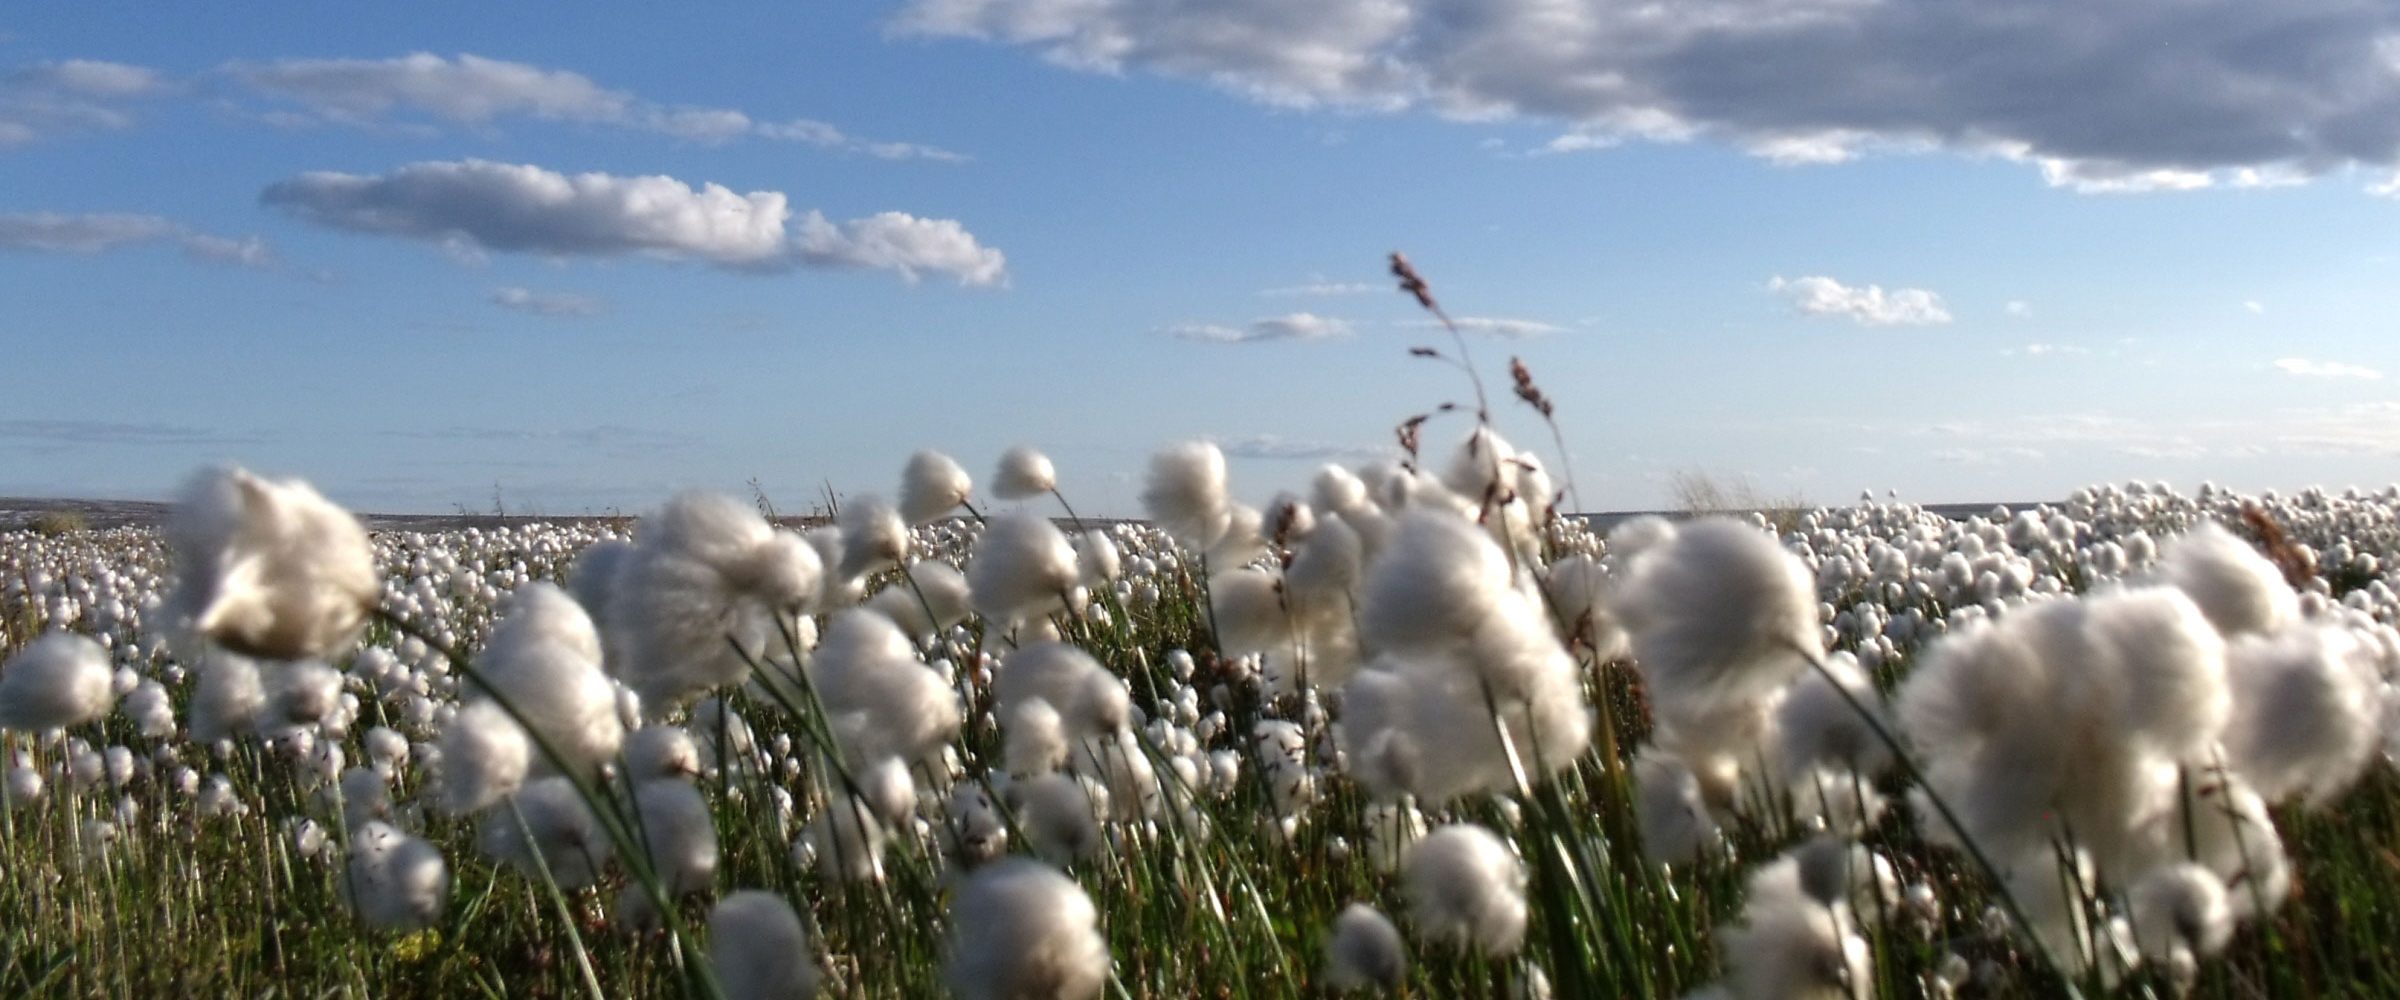
In order to produce all the cotton around the world in one year, 222 billion cubic meters are required.
Cotton, the real star
But not only what we eat has a high water footprint, the textiles we wear sometimes exceed it. 16,600 liters of water are the water footprint of a pair of leather shoes, but what contributes the most to increasing water expenditure are cotton garments.
In order to produce all the cotton around the world in one year, 222 billion cubic meters are required; this is the equivalent to 3.5% of the global water consumption for agriculture. This is due to the fact that each kilogram of cotton fabric requires on average 10,000 liters of water. Therefore, in order to produce a 250-gram T-shirt, 2,500 liters of water are required; in the case of a pair of jeans, the required amount of water reaches 10,000 liters.
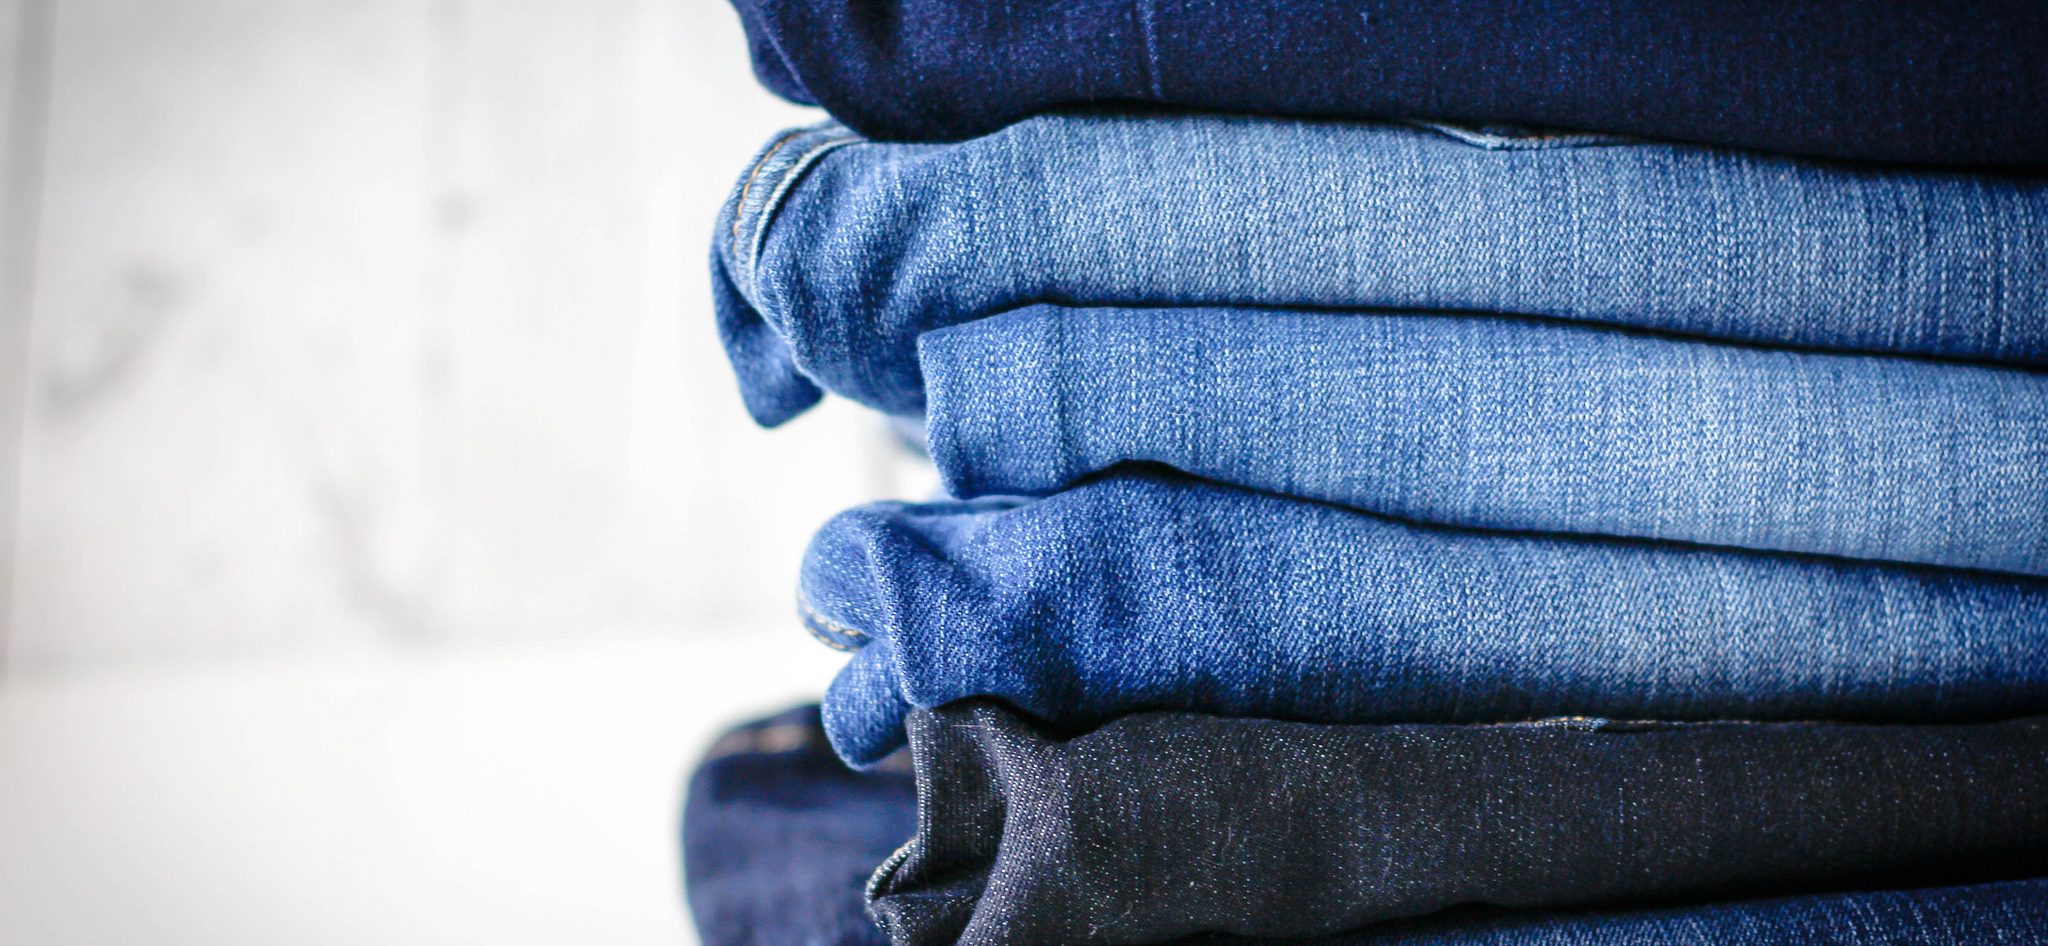
©Marco Verch
In order to produce a pair of jeans, the required amount of water reaches 10,000 liters.
The Water Footprint Network indicates that 45% comes from irrigation water (blue water footprint) and 41% is rainwater (green water footprint) consumed by the cotton plant or evaporated during the farming period. The remaining 14% is water in which fertilizers and industrial chemical products dissolve (grey water footprint).
In this sense, the manufacturing of cotton garments shows very clearly the concept of grey water footprint, which is the one with a more negative environmental impact. In the farming stage, pesticides, insecticides and fertilizers are the first pollutants; there is also pollution during transport, although mainly at the level of atmospheric gases; in the manufacturing stage, the pollution is carried out by dyes and other chemical products; and finally the finished product needs to be transported again. The calculation of the water footprint follows this entire process and concludes that the cotton industry contaminates 50 billion cubic meters of water every year.
An example of the devastating effects of uncontrolled cotton farming is the drying up and pollution of the Aral Sea, shown in the documentary Aral, the lost sea, made by the filmmaker Isabel Coixet for the We Are Water Foundation. What has happened there justifies the global concern caused by the proliferation of intensive crop farming in areas with a high water stress.
The great hidden water trade
The above figures are global averages that may vary greatly depending on the climate, rainfall or available technology, among other factors. Specific studies are required to obtain the exact water footprint of each product. The water footprint of cotton farmed in Egypt will not be the same as the one farmed in the US; nor will the vegetables grown organically have the same water footprint as the ones grown with fertilizers, for instance. Coming back to cotton, according to the Water Footprint Network, textiles from the US imply 8,100 liters for each kilogram, while those from India imply 22,500 and the ones from Uzbekistan 9,200.
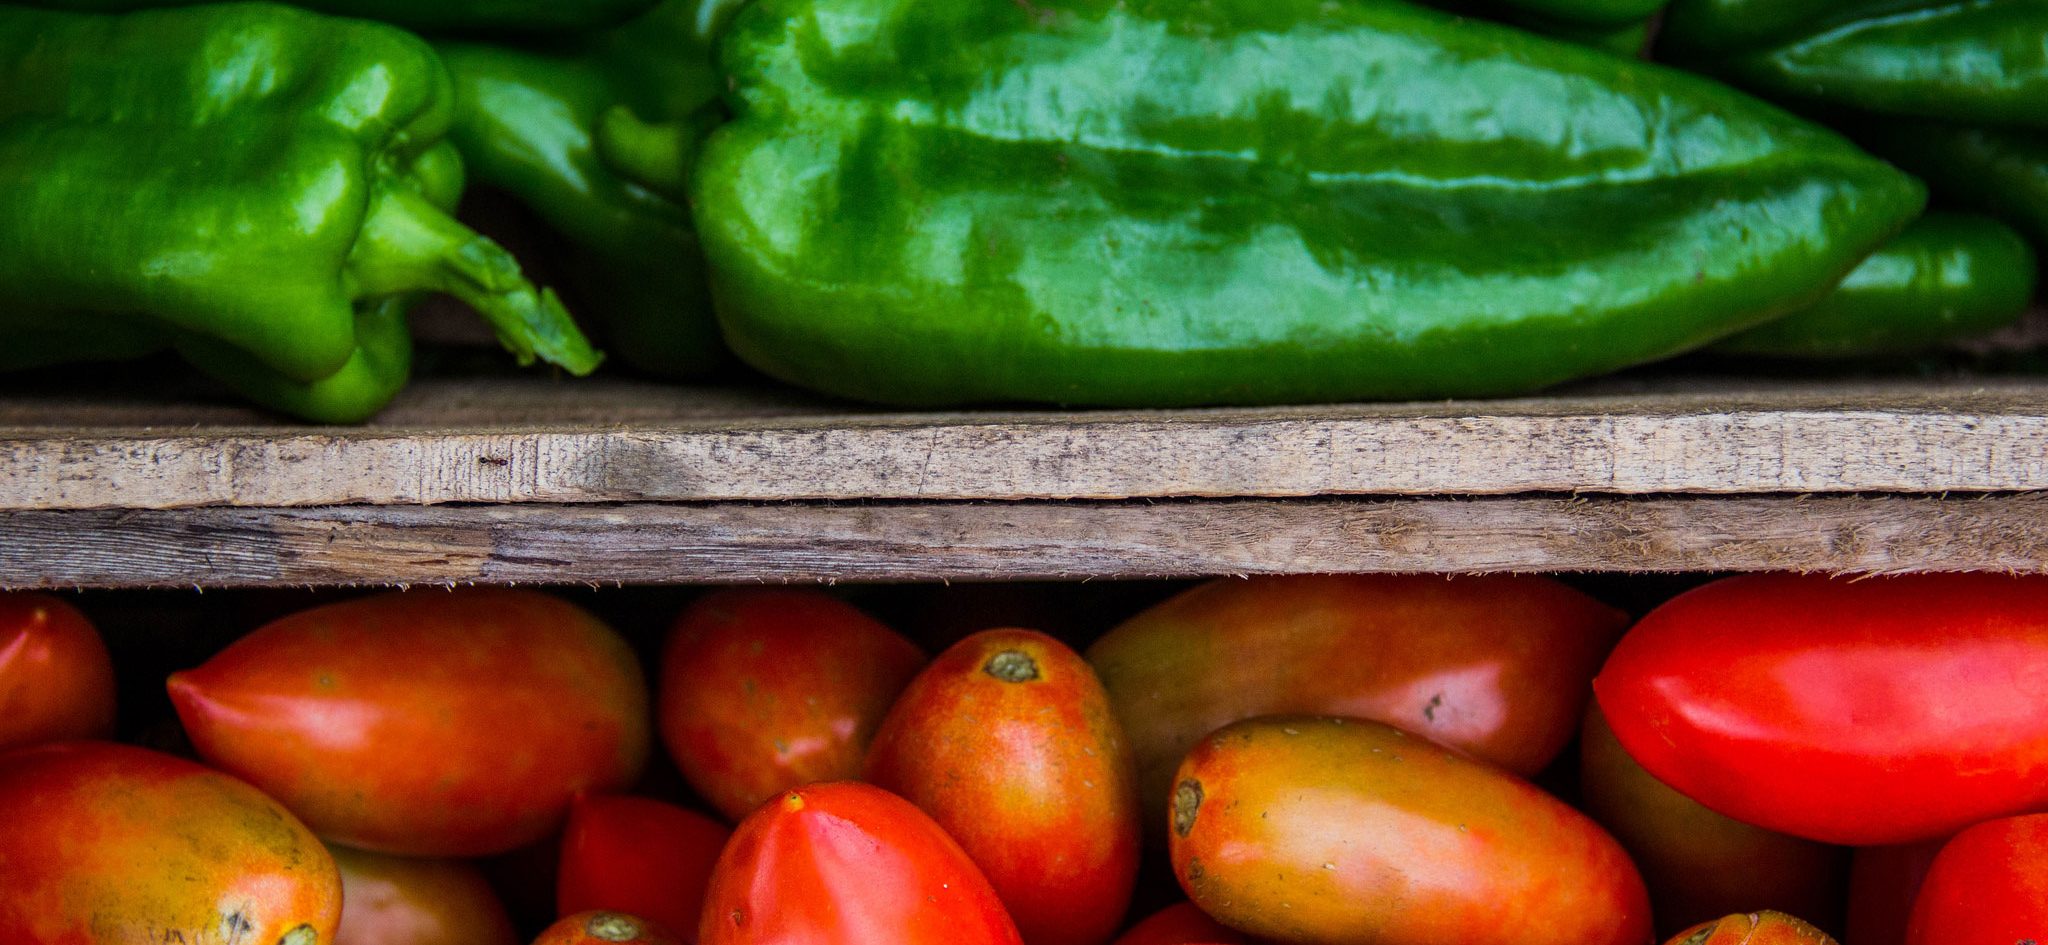
©Marco Verch
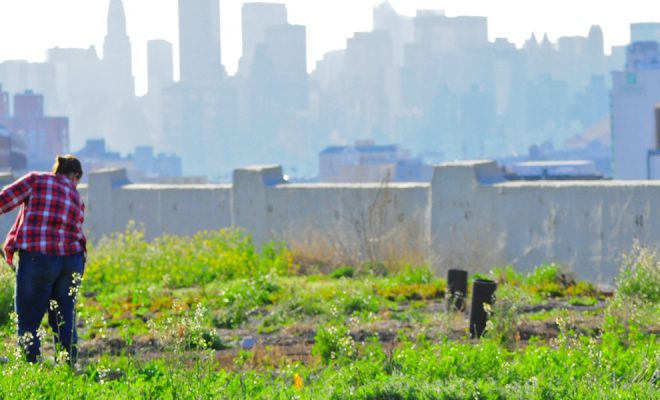
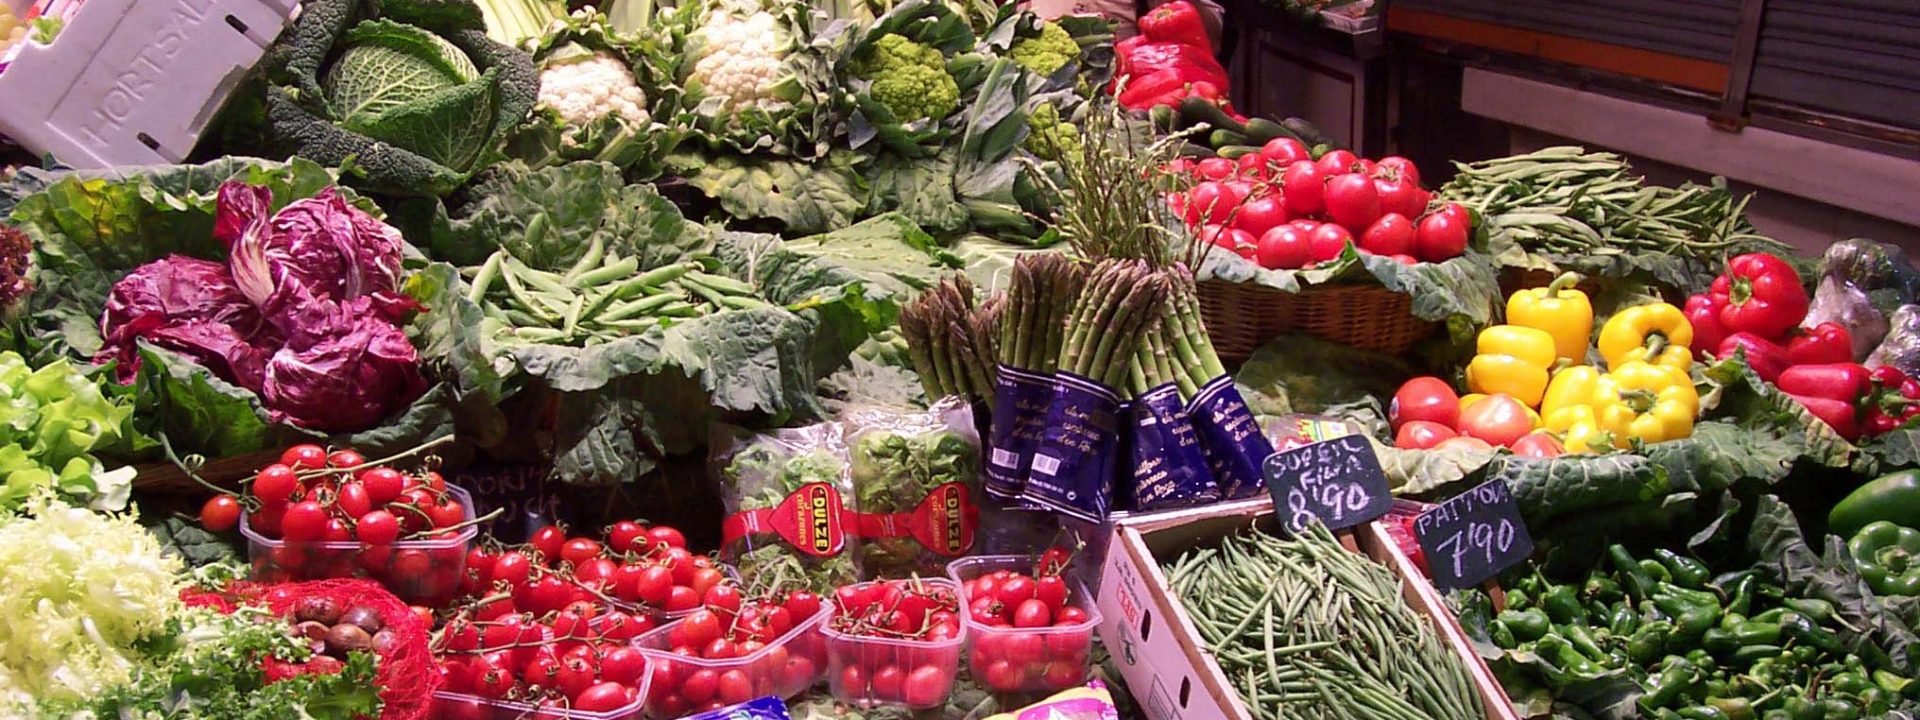
The vegetables grown organically don’t have the same water footprint as the ones grown with fertilizers.
Thus, the calculation of the water footprint also tells us that water consumption depends on the country goods are manufactured in and therefore, on the international trade balance (imports and exports).
In this sense, the study presented by the WWF in Stockholm showed another significant and surprising piece of information: only 38% of the water volume of the water footprint in the United Kingdom is “British water”, the rest comes from other countries. The report identified that most of this water came from agriculture in countries with a high water stress, such as Spain, Morocco, Egypt, South Africa, Israel, Pakistan and Uzbekistan, which despite having little water, act as its “exporters”. Thus, the water footprint revealed the “hidden transfer of water” between countries, a factor that in very little time has become essential to analyze the economic balance and the environmental sustainability.
The water footprint provides therefore information on trade flows in terms of water. According to Hoekstra, 16% of the water consumed globally travels virtually from some countries to others by means of products. Therefore, two different types of water footprint can be considered in each country: the external and internal one. The internal water footprint takes into account the internal use of water to produce goods and services consumed by its population: the external water footprint takes into account the water of imported goods or services, that is, the water used in other countries to produce them.
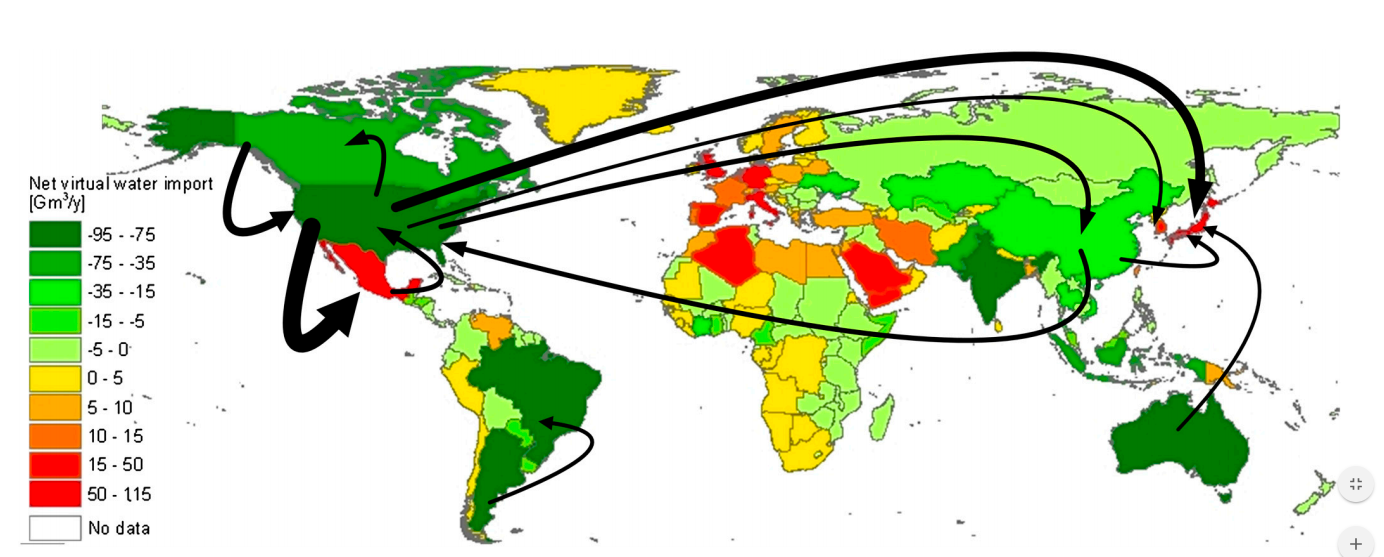
Balance of the “invisible” water trade between countries and the main activity flows, in the 1996-2005 period. (Only flows over 15 Gm3 per year are shown) © Arjen Y. Hoekstra and Mesfin M. Mekonnen Department of Water Engineering and Management, University of Twente.
Tools for global sustainability
The transfer of water over long distances is an indicator presented as a very useful alternative to improve the efficiency in the management of water resources on a global scale. Some countries can preserve their internal water resources by “saving water” and importing products with a high level of virtual water instead of producing them in their territory, which would mean an increase of their water stress. However, the calculation of the water footprint still needs to be further developed so that this hidden transfer of water is not counterproductive for those countries with few water resources and for the environment, as the pollution caused by transport needs to be taken into account and the abusive use of other resources that would hinder the efficiency of water savings needs to be avoided.
The water footprint has not been fully implemented by governments and companies yet and this needs to be done, as it is a necessary tool for the development of the circular economy. The ISO 14046 norm was passed in 2016, but as pointed out by Hoekstra himself in an interview in iAgua, it does not prescribe any specific method for assessing the water footprint that may be useful to companies and governments, and all organizations need to declare specific goals for reducing the water footprint for their supply chain in the areas most in need and implement action plans to achieve these goals.
What the water footprint shows is that the water problems of the planet will not be caused by the lack of water in the future, but by its lack of regulation. Making it efficient and fair is a challenge that affects us all. Not only companies and governments need to implement adequate practices along their supply chain, each one of us needs to reduce unnecessary costs of water by being aware of our consumption habits, identifying which ones increase the water footprint and trying to reduce them. Many commercial chains are international, and it is important to know what relation these companies have with the use of water in other countries. Knowing it and disseminating it is a necessary step we need to take in the future to create a new culture of water consumption.